Mapping gene expression, cell by cell
EMBL researchers complete a molecular atlas showing gene expression in all cells in an entire animal
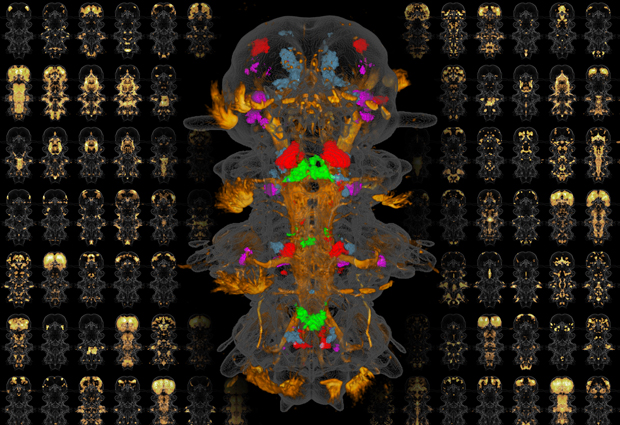
EMBL researchers have succeeded in creating a molecular atlas of a whole organism, studying the expression patterns of more than 100 important genes in each cell of the marine worm Platynereis dumerilii, as they report in the journal PNAS. Study authors Hernando Martínez Vergara and Detlev Arendt explain.
What’s the rationale for this study?
DA: We’re interested in the evolution of animals and in particular the evolution of the nervous system. Ultimately we’d like to understand how simple nervous systems gave rise to the complexity of the human brain. An important step in answering this question is identifying all the types of cells that are present in various organisms. We can then make comparisons to infer whether certain cell types in different organisms were inherited from a common ancestor, and at what point in the history of life they evolved. To be able to do this, we need to construct comprehensive atlases of cell types that exist in a range of organisms. That’s a huge technical challenge but we’ve now succeeded in creating one such atlas for Platynereis, focusing on gene expression. An international project is currently under way to create a human cell atlas, which is likely to take many years.
How did you create the atlas?
HMV: We studied Platynereis larvae that are six days old; at this point the larvae are fully formed with well-defined functional nerve cell types. We used a technique called whole-mount in situ hybridisation, in which we take a whole Platynereis larva and add label molecules that enter its cells and reveal where a particular gene is active. Separate observations in different larvae are carried out for each gene, and we then use a computer to superimpose all the resulting images. This allows us to see which genes are active in different parts of the animal. In this study we investigated about 100 genes that are known to be important for defining cell types.
What were the technical challenges?
DA: This would have been relatively straightforward if we were able to study larvae that are just a day or two old, since they have only a small number of cells and are almost identical from one specimen to the next. However, as development continues you start to see a lot more natural variation between individuals, so when you superimpose images of two organisms you find that their cells are not all located in the same place. As soon as the differences in position exceed one cell diameter, you can no longer be sure that you’re looking at the same cell.
How did you solve that problem?
HMV: I realised we could get round this by repeating each observation in several different specimens and then combining the images to create a sort of probability map of where each cell is located on average. With enough observations, you can make this average position precise enough to locate each individual cell in the organism. For this we needed a large number of observations – involving around 15-30 specimens for each gene we studied – so we had to use an automated microscopy system to obtain the large number of images required, and an automated computer workflow to process all the data.
Why did you choose Platynereis?
DA: Platynereis larvae are particularly suitable for this kind of study because they’re small organisms with a relatively well-developed nervous system, which they use to do things like orient themselves with respect to the light in the marine environment. We can therefore make meaningful comparisons with our own nervous system, but in an organism with many fewer cells – thousands rather than billions – which makes creating this kind of atlas much more feasible.
What are your next steps?
HMV: Platynereis has around 20,000 genes in total, so we’d like to expand the number of genes we’re looking at. One way we’re doing this is by complementing our atlas with data from single-cell sequencing, in which we analyse cells individually and identify all the genes that are active in each cell. For single-cell sequencing we have to break up the organism into individual cells, so we then can’t pinpoint exactly where each cell came from. However, by comparing the single-cell data with data on the genes we studied for the atlas, we can find out where the cell came from and the single-cell sequencing then gives us information about all the other genes that were not included in the atlas. Another thing we’d like to do is understand more about the structure of the nervous system in Platynereis. When you’re studying the nervous system, structure is everything. The small size of a Platynereis larva makes it possible for us to reconstruct its entire connectome – that is, the map of all the nerve connections in the organism. We do this by slicing the larva very finely and imaging the slices with an electron microscope. We now have data for the six-day-old larva comprising more than 11,000 slices at very high resolution. We plan to use this to trace all the nerves and nerve connections in Platynereis and combine this with our atlas. That will allow us to understand the nervous system of an organism in unprecedented detail.