See data in a new light
How 3D printing, gaming, virtual reality and lenticular posters can bring new perspectives to research
Tilt your head
By Margaux Phares
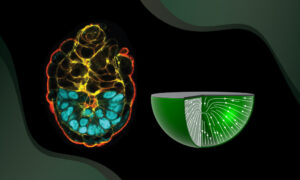
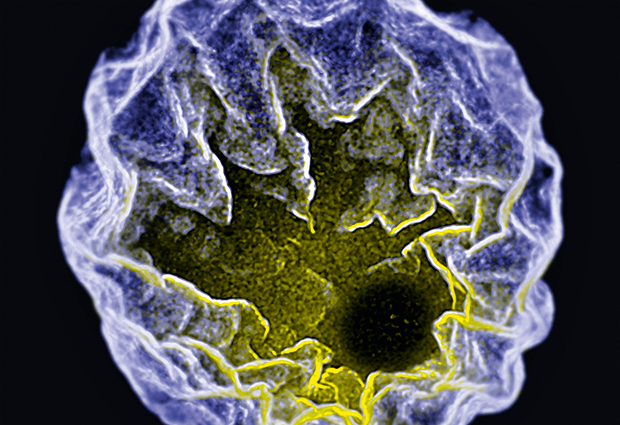
When it comes to lenticular posters, shifting your perspective is as simple as moving your head: What you see standing at one end of the poster may not be the same at the other end. But for several labs at EMBL, converting microscopic data into a 3D poster allows biologists to see what they never knew about before – from where proteins interact with a folding tissue, to how a Drosophila embryo develops. “We almost never see just a sharp surface,” EMBL scientist Stefan Günther points out. “We see reflections, we see shadings, we see noise.” For these reasons, visualising data in 3D can paint a more striking picture of the science.
“When you go back and forth on the computer screen and rotate a structure in 2D, you have to have the first structure in your head,” EMBL scientist Gustavo de Medeiros says. “But on a lenticular poster, if you just move your head to a different angle instead, the data is much clearer.” Life in Perspective, an exhibit to be showcased at the Heidelberg City Library in October and November 2016, will explore this medium by bringing small structures to larger scales. “The nucleus of the cell looks like a mountain, which is familiar to us,” Günther says. “That is one of the things scientists and society as a whole can benefit from – by showing real data as it is.”
Play a video game
Games are a powerful teaching tool, and scientists have turned to video games to gather data and crowdsource solutions to biological questions. But it turns out gaming can also be a way for scientists to improve their skills.
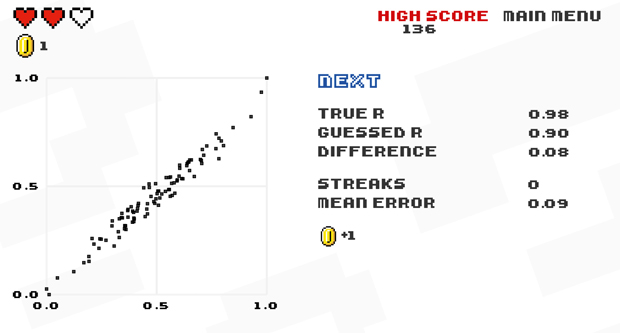
Omar Wagih, a PhD student in the Beltrão group at EMBL-EBI, created a game called Guess the Correlation, which challenges players to do something that scientists often must do: look at a graph showing dots plotted on two axes, and estimate how tightly linked – how correlated – the variables represented by those two axes are. Even seasoned scientists can get caught out, he says. “Sometimes people are so confident in their answer that they believe that the chart is wrong,” he says. “I’ve had people emailing me saying ‘there’s no way this is right, something’s wrong with your game,’ and I’ll send them the data so they can check for themselves, because the game was right.”
Besides alerting colleagues to how poorly human intuition can do at this task – and collecting data he hopes will help to reveal what kinds of graph people are most likely to guess wrong – Wagih says he has anecdotal evidence that players improve after playing repeatedly, implying this could be a way for scientists to hone an important skill. “I’m so much better at it now,” he says. “When I play it alongside friends, they’ll say ‘that’s a .6,’ or something, and I’ll say ‘no, it looks more like a .43’ – and my guess will be closer.”
Put on a headset
The idea of putting on a headset and stepping into your data may sound like science fiction, but some scientists say virtual reality could help us understand data better. EMBL group leader Theodore Alexandrov wishes he’d had access to the technology a few years ago, when he was working with collaborators studying the different molecules on the surface of lichens. “Lichens are such curly and intricate structures with parts sticking out at all possible angles, that it’s really difficult to recognise its shape on a photo or a 2D map. Does this part face sunlight or shade? Are these two parts touching each other?” he says.
Even with something as familiar as the human body, seeing things in 3D can make it more intuitive to generate hypotheses, Alexandrov argues: “It was way easier to understand data looking at even a simple 3D visualisation than when you’re looking at a spreadsheet!”
With new technologies like this, you never know what you can do until you actually start playing around
Virtual reality could also help biologists engage with colleagues from other disciplines, says Alexandrov: “A black and white image might mean a lot to experts, but for computer scientists it’s like something from the stone age. If you can show them something in VR, that’ll grab their attention!” Ivan Protsyuk, a bioinformatician in Alexandrov’s team who is exploring how virtual reality could be used in the lab’s own research, is aware that to become truly useful for scientific research, the technology will have to become more practical. “It would need plug-ins for programmes that scientists already use, and it would have to become simple enough to just put on the headset, look at something, then put down the headset and carry on working,” he says. “But with new technologies like this, you never know what you can do until you actually start playing around,” adds Alexandrov.
Hold it in your hand
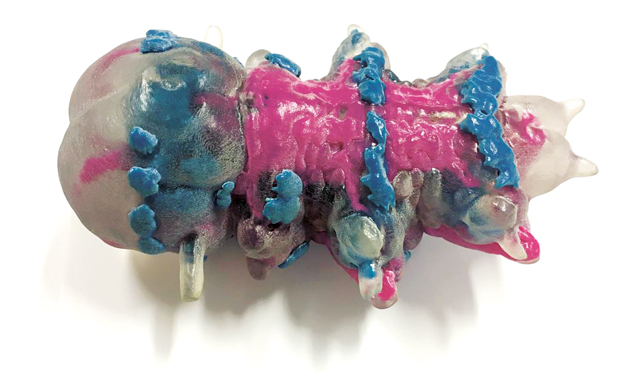
As 3D printing technology becomes more mainstream, it is making its way into the lab, too. “At first I wanted to have 3D printed things for how cool this technology is,” Hernando Martinez Vergara, a PhD student in the Arendt group at EMBL, admits. “But I was highly surprised to see that having a volume in your hand is way more telling than having it on a screen. I have spent dozens of hours looking at Platynereis’ body plan on screens, but just a few seconds of playing around with a 3D printed model revealed so many details I could not believe it!”
Christoph Müller, Joint Head of the Structural and Computational Biology Unit, says the same is true of his work in structural biology. “It really gives you a different perspective – you can literally ‘get to grips’ with things,” he says. “I sometimes take the model of a molecule and try to see where the active site would be, where things fit.”