Computational support & results
What will my results look like?
We deliver a comprehensive data analysis of the proteomics experiment along with the complete R script to ensure full reproducibility. Our pipeline includes contaminant removal, correction for batch effects, variance-stabilising normalisation and – if required – data imputation. Differential expression is assessed using moderated t-statistics from the limma package, and results are visualised through correlation plots and heat maps with clustering to highlight patterns in the data. To support biological interpretation, we also provide a basic Gene Ontology enrichment analysis for standard model organisms.
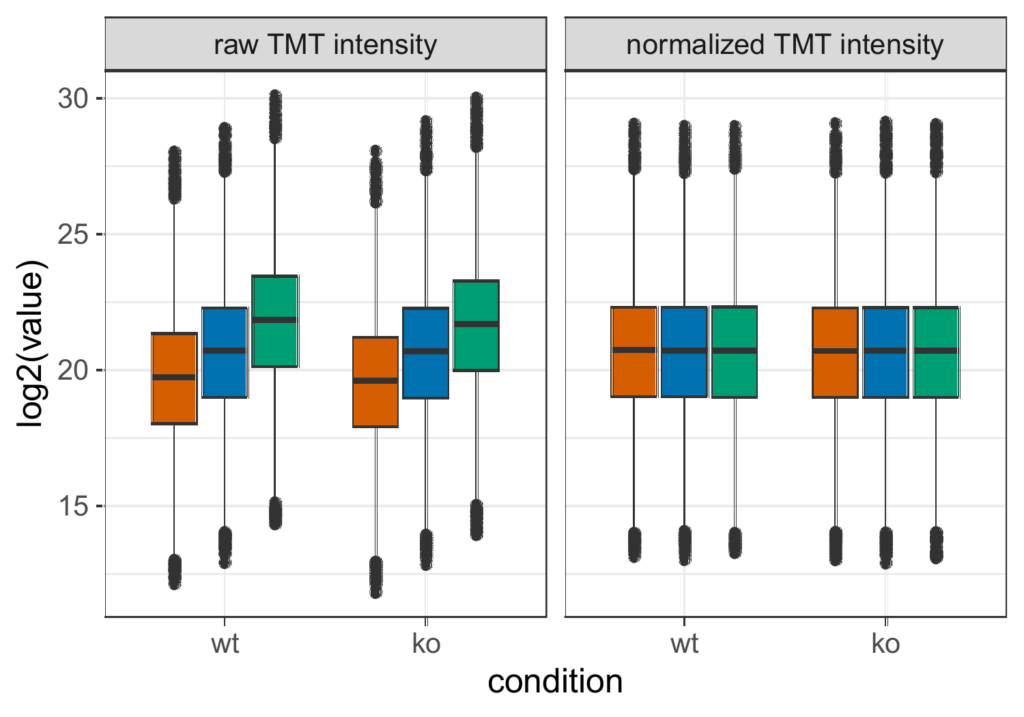
Data normalization
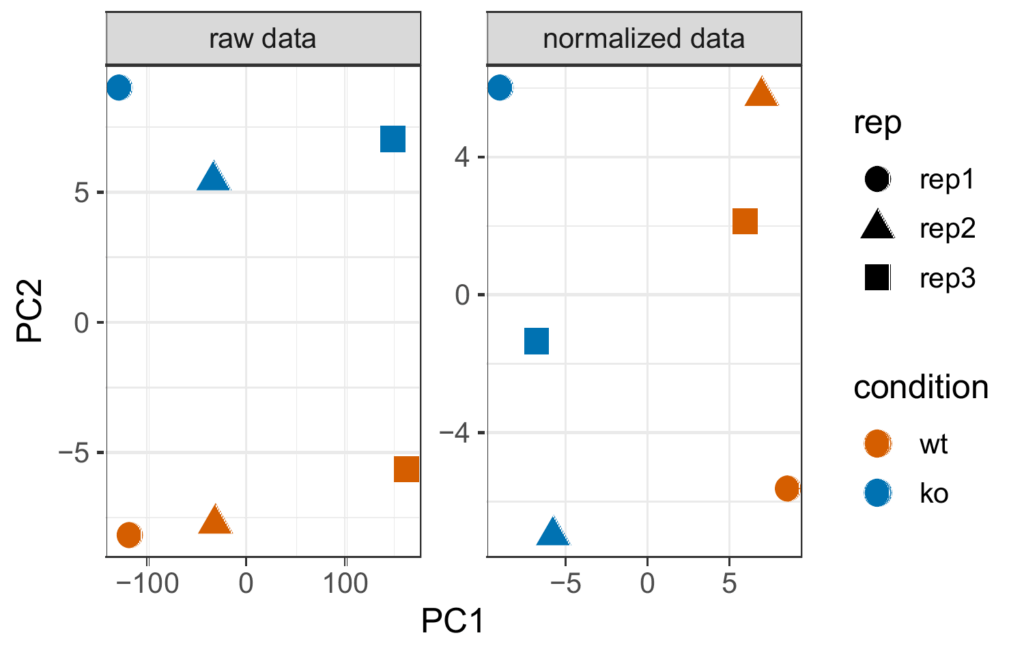
Principal component analysis (PCA)
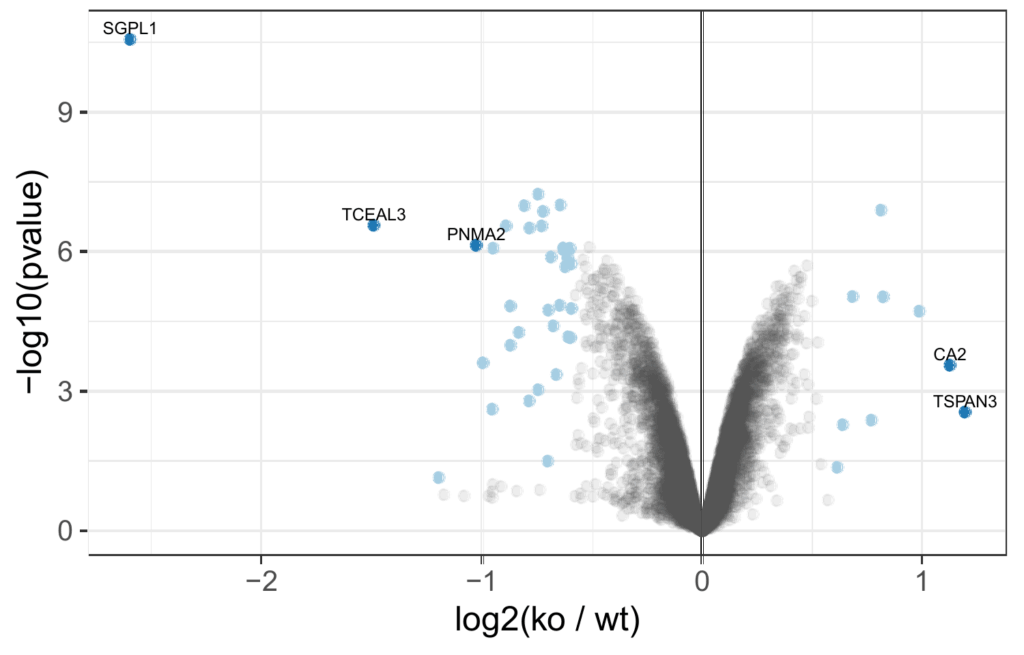
Volcano plot of differentially abundant proteins
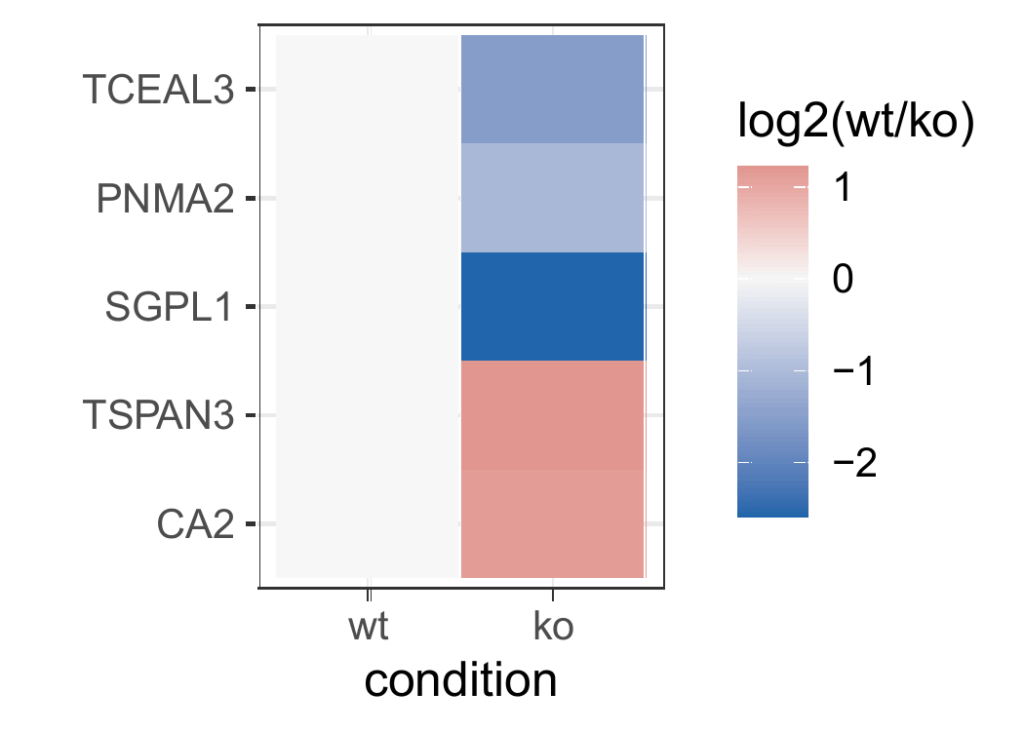
Cluster analysis
For data analysis, we primarily use UniProt Proteome Databases, which include only one representative entry per gene. As a result, information on individual isoforms is not reported.
If you require a specific or custom database, please inform us in advance and provide the corresponding database for use in the analysis.
Please consider whether this level of analysis is suitable for your research question. If distinguishing between isoforms is important for your study, let us know in advance so we can discuss possible options.
What can I expect from a typical proteome sample?
A full proteome analysis of an immortalized cell line, such as HEK293T cells, typically yields around 8,000 identified protein groups (with a minimum of 1 peptide per protein), of which approximately 7,000 proteins are quantified (minimum 2 peptides per protein) across compared conditions.
For other cell types, such as Escherichia coli, we generally identify about 2,200 proteins, with around 2,000 proteins quantified. These numbers vary significantly depending on sample type and proteome complexity.
For samples like tissue lysates, the number of quantified proteins is typically lower, around 4,000. Protein identification and quantification also correlate with MS analysis time and sample quality, including factors like lysis conditions and contamination.
For protein complex analyses (e.g., immunoprecipitations or proximity labeling), only a subset of the proteome is expected—often a few hundred proteins in a typical 90-minute LC-MS/MS run. We typically use TMT-based quantification for these experiments and to improve the quantification precision and achieve deeper interactome coverage, we usually perform high-pH offline fractionation, analyzing multiple fractions (commonly six).
The total number of identified proteins also depends on the quality of the FASTA database used. Please note, we cannot identify proteins absent from the database.
In case your protein of interest is not detected, there are several possible reasons. Smaller proteins tend to produce fewer tryptic peptides. The distribution of tryptic cleavage sites along the protein sequence may be uneven. Low expression levels can also limit detection. Additionally, the protein’s cellular localization and the efficiency of lysis can affect whether it is identified. Finally, proteins expressed from other species may not be detected.