Edit

Annual Report 2025

People, Processes, Places

It was a year of celebration, but also several important transitions around EMBL.

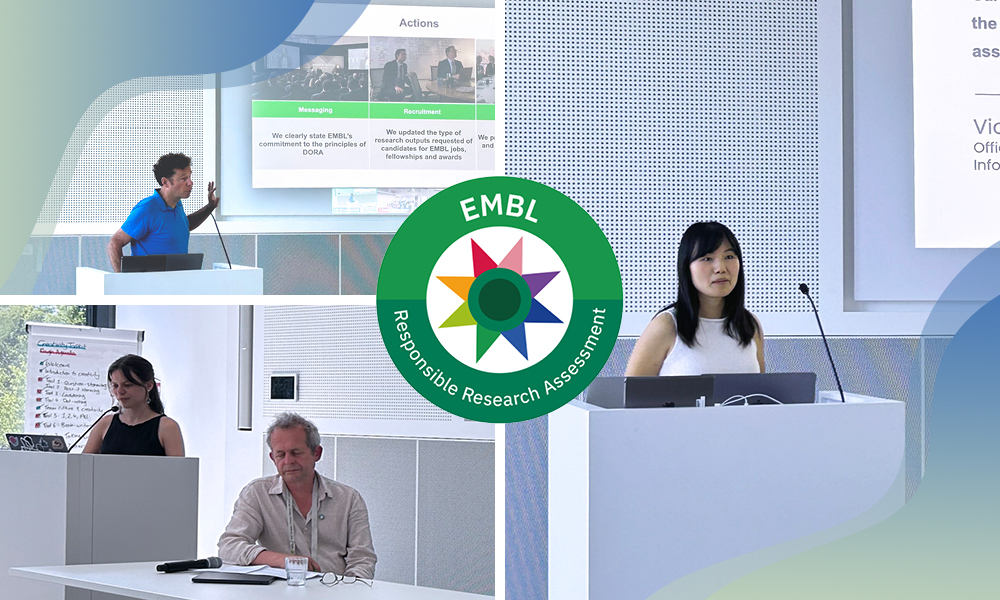
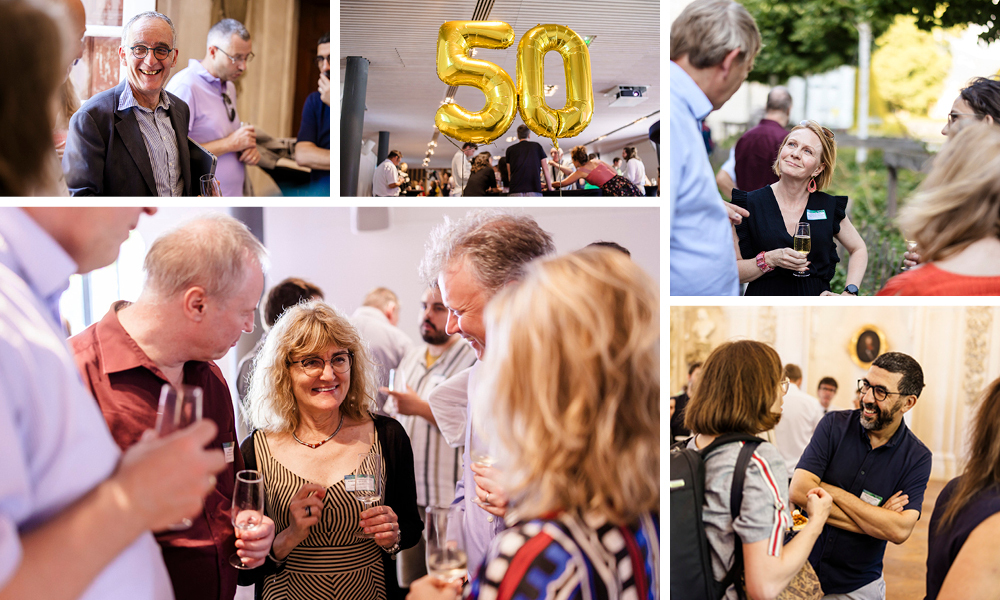
The year 2025 marked the 50th anniversaries of two EMBL sites: Hamburg and Grenoble. We bid farewell to our Director General, Edith Heard, former EMBL-EBI Director Rolf Apweiler, and EMBL Hamburg Head of Site, Matthias Wilmanns. We welcomed a new Chief Operating Officer, Michael Milne, and Sarah Dickinson Hyams as Head of People and Culture Development. The year also included an important pan-EMBL event on responsible research assessment.


“Science cannot reach its full potential unless it can benefit from the talents of everyone, and creating inclusive and safe environments where everyone can thrive is key to that. EDI is about creating work environments and cultures that are fair and equitable and where everyone, no matter who they are or where they’re from, can succeed.”

– Sarah Dickinson Hyams, EMBL Head of People and Culture Development

How we do science

Scientific excellence thrives when the organisation thrives. EMBL continues to prioritise and advance many initiatives, including those in sustainability; responsible research assessment; and equity, diversity, and inclusion.

People are EMBL’s magic. EMBL people possess an ever-present, intrinsic creativity. You can go to someone with a problem or a question, and they immediately come up with ideas and solutions.

– Edith Heard, Director and Chief Executive of the Francis Crick Institute; former EMBL Director General (2019–2025)

EMBL evolving

As two EMBL sites celebrated milestone anniversaries, EMBL saw important leadership changes for the organisation that will likely help shape the coming years.

EMBL sites celebrate 50 years

It’s been 50 years since both  EMBL Grenoble and EMBL Hamburg became part of Europe’s life sciences laboratory.

People, Processes, & Places in Numbers

Gender distribution at EMBL

EMBL aims to be transparent about its gender distribution. While gender distribution is balanced across the organisation as a whole, the EDI strategy aims to balance the inequalities seen in some staff categories.

Pie chart showing: Female 51%,
Male 49%
Bar graph showing: percentages female to male staff in categories:
51	:	49	Research
43	:	57	Scientific services
36	:	64	Scientific or technical support
82	:	18	Training and outreach
73	:	27	Administrative support
37	:	63	General support

Footnote: Six personnel members identified as non-binary


A more sustainable EMBL

Metrics are compared to baseline year 2019. EMBL continues towards its sustainability goals.

Graphic showing: 25% reduction in energy-related carbon footprint 
29% reduction of CO2 from business travel
22% reduction in residual waste

Personnel

Total 1,990 in full-time equivalents (FTE)

Personnel categories
Pie chart showing: Personnel categories in 2025		
1256 Staff members	
282 	Postdocs	
232	PhD students	
126	Supernumeraries and ancillaries	
94	Diploma students and trainees
Staff classification
Pie chart showing:
Staff classification in 2025		
in full-time equivalent (FTE)		
793	Research	
505	Scientific services	
252	Scientific or technical support	
118	Training and outreach	
183	Administrative support	
139	General support
Staff nationalities
Pie chart showing: Staff nationalities in 2025		
in full-time equivalent (FTE)		
1341	EMBL member or associate member states
18	EMBL prospect member states
631	Non-member states

Financial report

Financial report

Member states provide the majority of EMBL funding, with additional external support from a wide range of grant-endowing bodies and philanthropic contributions.

EMBL total income

€373.6 million

Pie chart showing: 
44% Member state contributions
3% Member state special contributions (1)
19% External grant funding
4% Other external grant funding (2)
29% Other receipts (3)
External grant funding

€72.7 million

Pie chart showing: 15
%
NIH
20
%
EC
17 
%
Wellcome Trust
18
%
ERC
6
%
BBSRC
5
%
DFG
2
%
BMBF
1
%
HFSPO

1. Includes additional contributions from the UK government for the second phase of the EMBL-EBI Data infrastructure programme.

2. Includes ELIXIR member state contributions.

3. Includes items such as philanthropic donations, contributions from EMBO, course and conference fees, internal tax, and income from the Heidelberg canteen, cafeteria, and guesthouses.

Member state contributions
Graph showing member state breakdown of funding.

EMBL total expenditure

EMBL’s expenditure prioritises research, scientific services, and training activities – all of which are geared towards collaborating with, scientifically supporting, or training member state scientists.

€358 million

Expenditure
Pie chart showing: 67 % Staff costs
27 % Operating costs
6 % Equipment expenditure, including depreciation
Expenditure by area of activity
Pie chart showing: 32% Research
27% Scientific services
11% Scientific or technical support
8% Training and outreach
12% Administrative support
10% General support
Edit