This facility provides a full proteomics infrastructure for the identification and characterisation of proteins.
Our services are primarily available to EMBL researchers. We also support external academic institutions. Services for industrial partners may be offered depending on our available capacity.
To get the most out of your proteomics experiment, we strongly recommend reaching out to us as early as possible. Early contact allows us to support you in shaping the experimental design and ensuring optimal results.
We can assist with key aspects such as:
To get started, please email us at pcf@embl.de.
Include the following information to help us assess your project and guide you effectively:
By sharing this information, we can ensure that we design the most effective experiment tailored to your needs. This will also allow us to provide you with a rough cost estimate.
We can only accept samples accompanied by a completed service request form. This form provides all the essential information needed to process and analyze your samples.
A separate service request must be submitted for each individual set of samples.
Please note:
If you are analyzing a custom or modified protein, please provide its full amino acid sequence, including:
To help us interpret the sequence, please highlight tags, mutations, and cleavage sites in color.
EMBL Internal users have to submit their service request form via the PPMS system.
For this an account in the system is necessary. Please follow this link to access the system.
Please note that you cannot request a certain instrument and we do not allow pre-booking of instrument time.
These are the essential requirements for standard procedures:
Experiment type | Material submitted to PCF |
Cell lysates | 20 µg |
Secretome, extracellular vesicles (EVs) | 5-10 µg |
Phosphoproteomics from lysates | 500-1000 µg |
Crosslinked protein complex | 50 µg |
Pull-downs, Immuno-precipitations | 60 µL of eluate |
Contaminants such as abundant serum proteins – especially from residual fetal calf serum (FCS) or bovine serum albumin (BSA) – can interfere with mass spectrometric analysis. To minimize these effects, we strongly recommend washing cultured cells three times with buffer such as PBS prior to lysis.
Most commonly used lysis buffers are compatible with our protein digestion workflow, including:
Our in-solution tryptic digestion is based on a modified SP3 protocol (PMID: 25358341). For a detailed list of tested and compatible reagents, please refer to Figure 1B in the referenced publication.
You may include EDTA-free protease inhibitor cocktails or phosphatase inhibitors in your lysis buffers, as they are compatible with our workflow.
If cell lysis results in the release of genomic DNA, the sample may become highly viscous. To reduce viscosity and ensure proper processing, please treat samples with benzonase or perform sonication. This step is also important for efficient recovery of nucleic acid-bound proteins.
Accurate protein quantification is essential for reliable mass spectrometry-based relative quantification. To ensure consistency and comparability across your samples, we require:
To determine protein concentration reliably, we recommend the following approaches:
Important Note
Protein concentration measurements using NanoDrop or similar spectrophotometers are not reliable and should be avoided.
In general, we recommend performing all possible quality control steps to ensure the success of the mass spectrometry analysis of your samples. These steps may include protein quantification, SDS-PAGE combined with Coomassie or silver staining, and Western blot analyses to verify knockout, expression, or enrichment of the protein of interest. However, we understand that sometimes it is necessary to proceed with mass spectrometry analysis without controlling every step, for example, when working with limited sample material.
If you plan to submit samples at the peptide level, please contact us in advance. Note that we can only accept peptide samples prepared in mass spectrometry-compatible buffers.
For a full proteome analysis, we recommend using buffers with harsh detergents such as SDS to ensure complete cell lysis. A suitable choice is RIPA buffer (0.1% SDS, 1% deoxycholate, 1% NP-40, 150 mM NaCl in 50 mM Tris/HCl, pH 7–8), supplemented with EDTA-free protease inhibitors. To reduce sample viscosity and facilitate protein extraction, it is essential to degrade DNA by adding Benzonase or using sonication, followed by removal of cell debris via centrifugation.
Accurate protein quantification is critical to provide equal protein amounts for reliable quantitative comparison between different conditions. We recommend determining protein concentration using BCA, Bradford, or Tryptophan assays, as methods like NanoDrop are not sufficiently accurate. Please adjust all samples to 20 µg of protein in 60 µL of lysis buffer (e.g., Laemmli buffer). Insufficient protein amounts may lead to incomplete proteomic analysis, while excessive protein concentrations can reduce digestion and TMT labeling efficiency.
If you cannot provide 20 µg per sample, please contact us to discuss alternatives.
For further details, please also see the Sample Submission section.
To isolate protein complexes, buffers containing 0.1% Triton X-100 with 150 mM NaCl in 100 mM HEPES/NaOH (pH ~7.5) are commonly used as a good starting point. However, we recommend optimizing lysis conditions for your specific protein of interest. More detailed guidance on lysis and immunoaffinity purification can be found here.
For secretome analysis, it is essential to culture cells in serum-free medium. The presence of abundant proteins, such as those from fetal calf/bovine serum, can dominate the sample and produce prominent peptides. Since the mass spectrometer prioritizes analyzing the most abundant peptides first, this can lead to detecting serum proteins like albumin instead of the proteins of interest in your sample.
We provide services for the mass spectrometric analysis of extracellular matrices (ECMs). Below is a selection of key publications relevant to ECM proteomics and sample preparation:
Phosphoproteomic analysis requires a high amount of input material—typically around 500 µg of total protein. The number of phosphopeptides detected is strongly dependent on the amount of starting material provided.
To ensure optimal results, please contact us in advance to receive our lysis protocol, which is specifically optimized for compatibility with our downstream phosphopeptide enrichment workflow.
Plasma and serum contain a few very high-abundance proteins (e.g., albumin, immunoglobulins) that can interfere with the in-depth analysis of lower-abundance proteins by mass spectrometry.
To improve proteome coverage, we recommend using the ENRICH-iST kit from PreOmics, which is specifically designed for the depletion of abundant plasma proteins: https://www.preomics.com/products/enrich-ist
For gel samples only:
EMBL Heidelberg
*your contact person at PCF*
Proteomics Core Facility
Meyerhofstr. 1
69117 Heidelberg
Germany
In order to avoid any delay in receiving your samples, please follow our requirements for shipping samples from non-EU countries and add a proforma invoice to your shipment.
Please note: During periods of high demand, processing times may be longer than stated.
Please note that upon completion of the project (after receipt of the data) we will store the remaining samples for 8 weeks.
Please also note that we do not send any samples back.
The raw files of your experiment are archived for 10 years on our server.
Please note: Our facility is charging solely for the consumables and measurement time. Costs depend on the sample type, complexity and number of samples.
These are our current fees for external customers (as of August 2025):
Prices for external customers | |
---|---|
Sample processing fee (per sample) | 3 € |
TMT6-plex (up to 6 samples) | 100 € |
TMT11-plex (up to 11 samples) | 200 € |
TMT18-plex (up to 18 samples) | 280 € |
Sample desalting (per sample) | 20 € |
Phosphoenrichment incl. desalting (per sample) | 20 € |
Peptide-SEC / high pH / PGC fractionation (per sample) | 20 € |
Measurement time (per hour) | 100 € |
You have six conditions, each with three replicates, and you want to look at changes in protein expression on the whole proteome level (e.g. from cell lysates, tissue lysates, or subcellular fractions).
This would be a TMT18 experiment (18 samples total), and the cost is €3,044 (excluding tax), which includes our standard data analysis.
Price | |
---|---|
TMT18-plex labelling reagent | 1x 280 € |
high pH fractionation | 1x 20 € |
desalting | 1x 20 € |
consumables | 54 € (18x 3 €) |
pre-Run of 90 min + 30 min blank run | 200 € (100 €/h measurement time) |
120 min measurement of 12 fractions, followed by 30 min blank run | 2450 € (total of 24.5 h) |
Total sum (without VAT) | 3044 € |
You have 20 samples that you would like to measure in DIA mode (recommended for tissue samples, muscle cell lines, or in case you have more than 18 sample to compare)
Price | |
---|---|
consumables | 60 € (20 x 3 €) |
120 min measurement of 20 samples, followed by 30 min blank runs | 5000 € (total of 50 h; 100 €/h measurement time) |
Total sum (without VAT) | 5060 € |
You have a co-immunoprecipitation in triplicates (3x bait IP + 3x control IP). This would be a TMT6 approach. Since you purify a certain protein along with its interaction partners and some contaminants you expect a reduced set of proteins to be detected (“medium” complexity sample) as compared to a full proteome sample (e.g lysates).
Price | |
---|---|
TMT6-plex labelling reagent | 1x 100 € |
high pH fractionation | 1x 20 € |
desalting | 1x 20 € |
consumables | 18 € (6 x 3 €) |
pre-Run of 60 min + 30 min blank run | 150 € (100 €/h measurement time) |
60 min measurement of 6 fractions, followed by 30 min blank run | 650 € (total of 6.5 h; 100 €/h measurement time) |
Total sum (without VAT) | 978 € |
You have a prominent band on a Coomassie-stained gel and want to identify or confirm the protein. This is considered a low-complexity sample, since we expect only a few proteins to be present.
The cost for analyzing each band is €103.
Price | |
---|---|
consumables | 3€ (1 x 3 €) |
30 min measurement of sample, followed by 30 min blank run | 100 € (total of 1 h; 100 €/h measurement time) |
Total sum (without VAT) | 103 € |
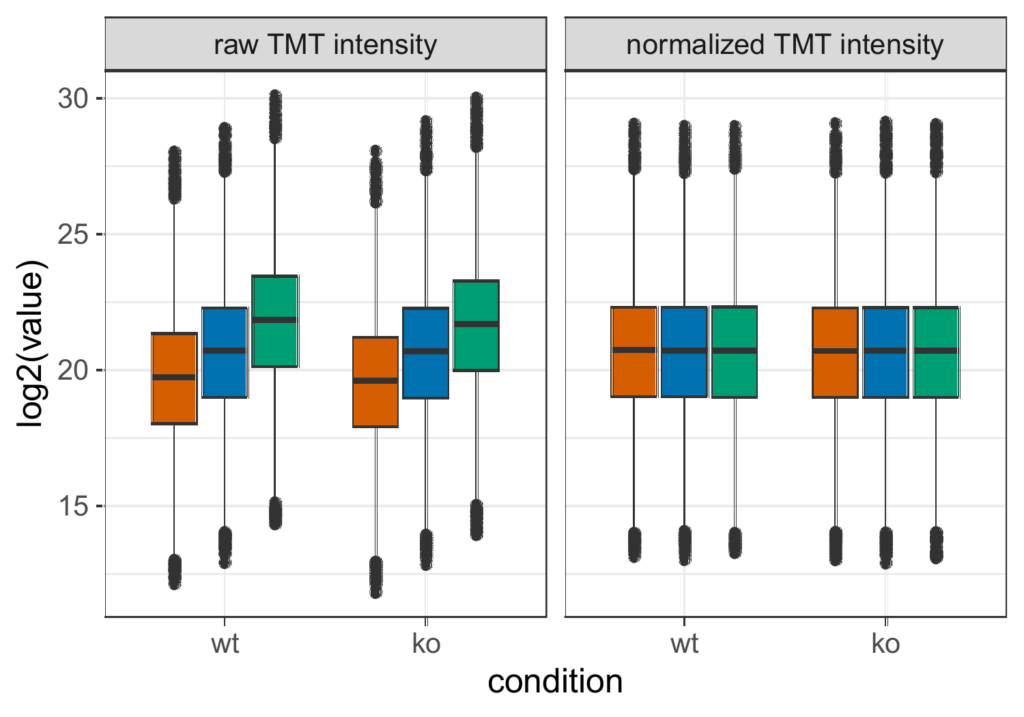
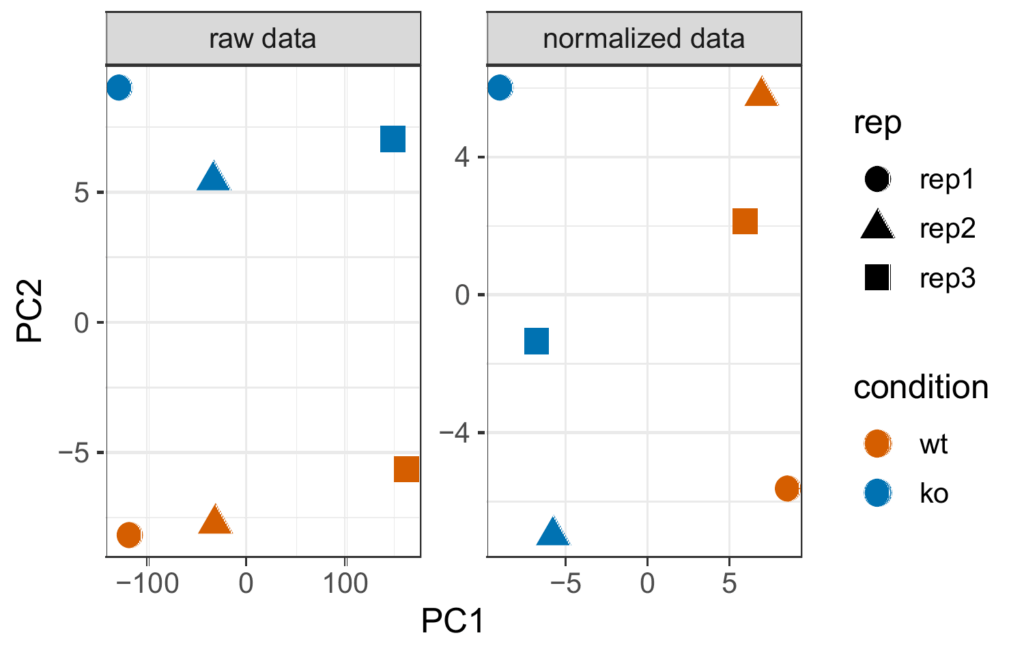
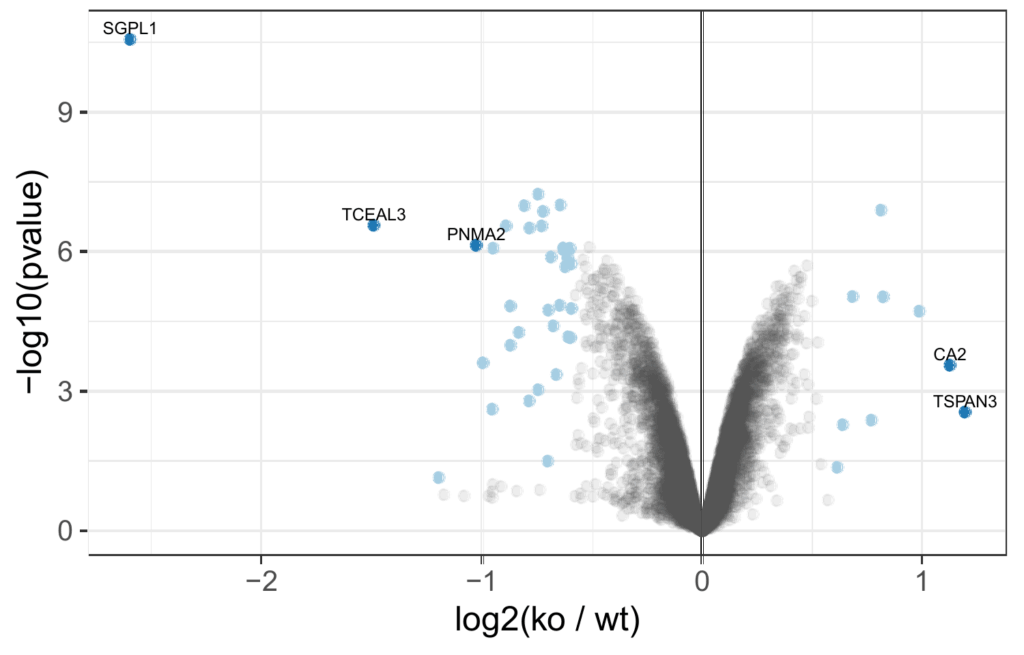
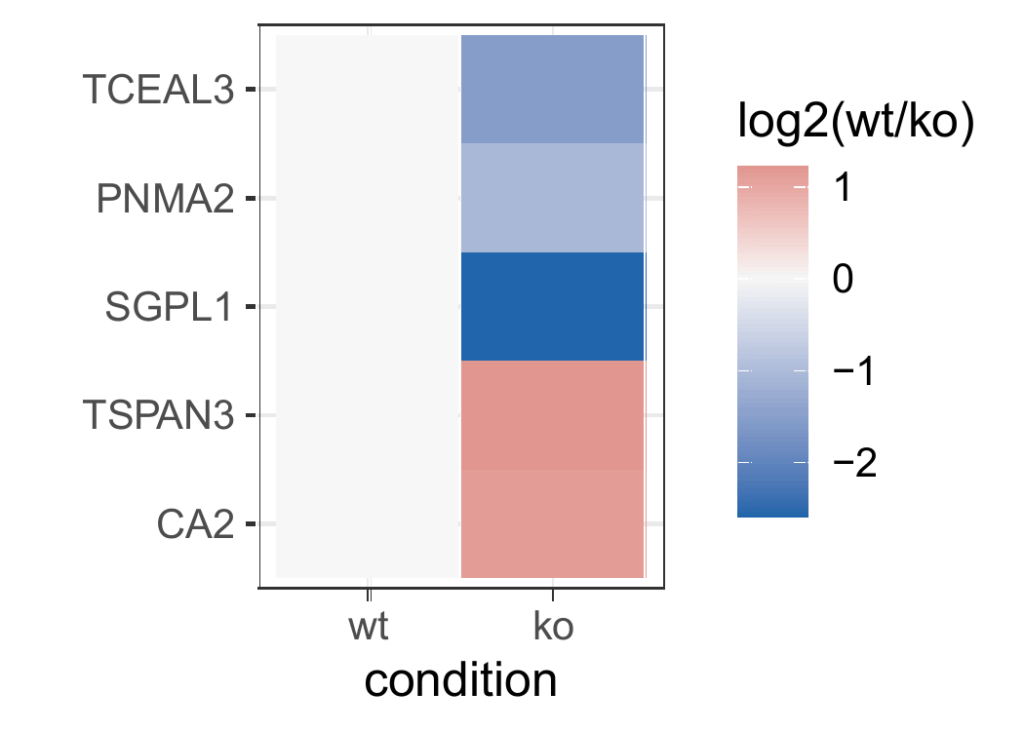
We deliver a comprehensive data analysis of the proteomics experiment along with the complete R script to ensure full reproducibility. Our pipeline includes contaminant removal, correction for batch effects, variance-stabilising normalisation and – if required – data imputation. Differential expression is assessed using moderated t-statistics from the limma package, and results are visualised through correlation plots and heat maps with clustering to highlight patterns in the data. To support biological interpretation, we also provide a basic Gene Ontology enrichment analysis for standard model organisms.
For data analysis, we primarily use UniProt Proteome Databases, which include only one representative entry per gene. As a result, information on individual isoforms is not reported.
Please consider whether this level of analysis is suitable for your research question. If distinguishing between isoforms is important for your study, let us know in advance so we can discuss possible options.
A full proteome analysis of an immortalized cell line, such as HEK293T cells, typically yields around 8,000 identified protein groups (with a minimum of 1 peptide per protein), of which approximately 7,000 proteins are quantified (minimum 2 peptides per protein) across compared conditions.
For other cell types, such as Escherichia coli, we generally identify about 2,200 proteins, with around 2,000 proteins quantified. These numbers vary significantly depending on sample type and proteome complexity.
For samples like tissue lysates, the number of quantified proteins is typically lower, around 4,000. Protein identification and quantification also correlate with MS analysis time and sample quality, including factors like lysis conditions and contamination.
For protein complex analyses (e.g., immunoprecipitations or proximity labeling), only a subset of the proteome is expected—often a few hundred proteins in a typical 90-minute LC-MS/MS run. We typically use TMT-based quantification for these experiments and to improve the quantification precision and achieve deeper interactome coverage, we usually perform high-pH offline fractionation, analyzing multiple fractions (commonly six).
The total number of identified proteins also depends on the quality of the FASTA database used. Please note, we cannot identify proteins absent from the database.
In case your protein of interest is not detected, there are several possible reasons. Smaller proteins tend to produce fewer tryptic peptides. The distribution of tryptic cleavage sites along the protein sequence may be uneven. Low expression levels can also limit detection. Additionally, the protein’s cellular localization and the efficiency of lysis can affect whether it is identified. Finally, proteins expressed from other species may not be detected.