Capturing life in perspective
How a team of scientists and artists at EMBL transformed microscopy data into stunning 3D images
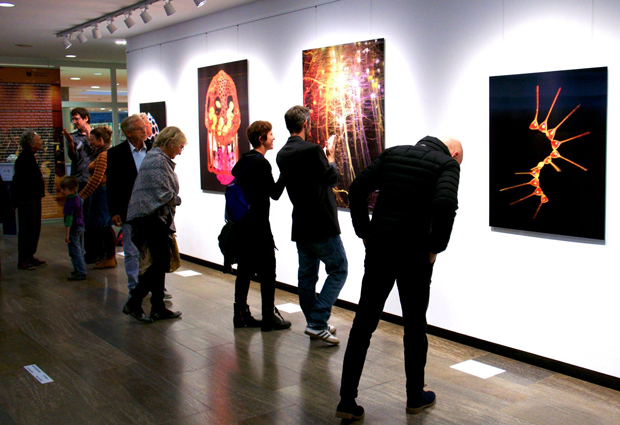
Shattering starfish nuclei. Cells collapsing like fabric. Protein puzzles with thousands of pieces. These moments of microscopy are commonplace in the lab, but for one team of scientists at EMBL they offer an artistic perspective on the biological sciences. ‘Life in Perspective,’ a visualisation of 3D microscopy as lenticular images, was recently displayed at the Heidelberg city library. Going from microscope to capturing the perfect picture was not without experimentation. From collecting data to timing snapshots of chemical reactions, the scientists and co-creators of the art exhibition share some of their challenges, how they took them on and what ‘Life in Perspective’ means for communicating science beyond the lab.
The germ of an idea
“Initially this project began because Stefan [Günther] and I just wanted to look at our research data in a different way,” explains Gustavo de Medeiros, a postdoc in the Hufnagel group at EMBL in Heidelberg. But soon the ambition of the pair of scientists grew. “We realised it did not make sense to just keep this up in the lab – we wanted the public to see science communication as art. We envisioned a huge, interactive exhibition, where people could touch and see and discuss the art and science.”
At first, it was not easy. “Organising something like this was completely new for us, as well as for EMBL,” de Medeiros continues. “I think because we had so many ideas at once it was tough convincing people to support us at the beginning. But we kept going.”
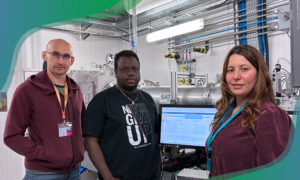
A few key supporters helped to get the ball rolling. “Stefan and Gustavo approached me for advice and help getting to administrative contacts,” says Manuela Beck, a graphic designer working at EMBL. Joran Deschamps, a PhD student at EMBL, also joined the team. Not only did he work with Günther and de Medeiros on the science, but he also pushed the project to remain artistic in focus. With the support and guidance from EMBL Director Matthias Hentze, the team decided to focus on one technique – lenticular images – and showcased six images for the 2015 Annual Reception at EMBL. This exposure piqued more people’s interest in the project and prompted numerous labs to contribute.
“We put out an open call for data to create more prints,” de Medeiros says. “We were surprised to find that some data is stored but remains unused. It just sits on a shelf!”
Once the data was provided it had to be processed. “For me it was very beneficial to work together with scientists and to realise that there is not a big difference between art and science when doing creative work,” says Beck. “This exhibition is a good opportunity for scientists and non-scientists to be fascinated by the beauty of a microscopic organism. Although in the beginning, you don’t even need to know what it is – it could be anything! The part of it I find the most fascinating is that you’re implicitly part of it. These pictures are like open doors to see what’s inside your body, or what’s at the bottom of the ocean that’s invisible to our eyes.”
Bug data
The first challenge to making data look good visually was to make the final image look like something our brain would expect. “To represent a 3D volume from a stack of 2D slices was difficult to understand – how do you project volumes in such a way that the brain thinks they are in 3D?” de Medeiros says. In traditional projections, all of the 2D slices would be collapsed onto one plane. To our brain, this looks weird, since we cannot perceive depth in this way. To overcome this obstacle, de Medeiros and his colleagues used a technique to make our brain think the image has perspective.
And then there is the sheer amount of data to work with, as Günther demonstrates. His image follows a fruit fly embryo in development, from the point of fertilisation up to gastrulation, or the stage when the single layer of cells that initially form the embryo fold inward. During this timeframe, one nucleus turns into hundreds, and they migrate to the surface of the embryo. The cells keep dividing until they reach about 6000 in number. Günther was then faced with a formidable challenge: visualising this stage of development in a quality that could track down every one of these thousands of cells.

“With light sheet microscopy, the method that we used, we generated a lot of images,” he says. “A single time point consists of 200 images in order to record the depth. The entire video we recorded of the fly developing was over 24 hours long and consisted of 2 terabytes of data, which is four times the size of a normal computer hard drive! In the end, we only show about 30 minutes of the video.”
Reworking data
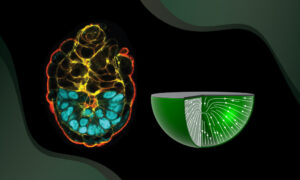
Jan Kosinski, of Martin Beck’s group at EMBL Heidelberg, was part of a team that pieced together the structure of a nuclear pore. They first used electron tomography to get a rough idea of what the nuclear pore complex looked like. They then identified the structures of the component proteins, previously found using methods such as X-ray crystallography, to piece together the final structure.
“This is how we solved the puzzle, so to speak – having a template and a thousand pieces, and fitting them together using software we designed,” Kosinski explains. “Imaging the nuclear pore was a project more than five years in the making: When I joined the project, it still took one year to generate the first initial shape, and another year to fit the pieces in it. I’m proudest of making the automated program that takes these pieces and puts them all in place. And of course, that we solved the biggest protein structure in the cell. It is mind-blowing!”
The yellow and red proteins on the outer ring of the pore form a repeating unit. With scientific publications, according to Kosinski, similar proteins such as these are shaded in similar colours. But for the exhibition, Kosinski coloured the proteins in the nuclear pore differently from how he did it for a report published in Science. “In both scientific publications and this art exhibition,” he says, “colour choice is arbitrary. But for ‘Life in Perspective’, Stefan and Gustavo preferred to use colour to increase the perception of depth in the pore.” The deeper you move into the channel, the more blue proteins you see; the farther out you go, the more red ones you see.
Exploding opportunities
Unlike Kosinski, who used existing data for the project, postdoc Natalia Wesolowska in Péter Lénárt’s lab had to collect new data so that she could generate an image with sufficient resolution for the large lenticular prints. Her image of a starfish oocyte, or egg cell, shows its nucleus about to burst open so the oocyte can pass on half of its chromosomes to its daughter cell as it becomes a mature egg. A protein called actin floods the nucleus and forms a shell that helps the nuclear membrane to shatter. But first, the oocytes need to receive a hormonal signal that says, “It’s time to divide” – something Wesolowska can signal to the oocytes in the lab. After that, it’s time to quickly prepare the cells for imaging with confocal microscopy.
“In order to prepare the cells for imaging, we have to capture them in that particular moment of time – when actin has gone into the nucleus – and then make them visible with antibody staining,” she explains “Whenever you use fixatives, you worry about destroying certain structures in the cell and actin is particularly sensitive in this regard. Part of the difficulty of this project was to find a way to fix the actin and make sure it looks the way it normally does in a cell. We had to tweak what chemicals we used, so it’s just right.”


The time window in which to fix the oocytes is also quite small. “After I introduce the hormone, which signals the cell to divide, it usually takes about 15 to 20 minutes before I see the nucleus start to look crumpled – like a deflated balloon. And I then know that the actin-flooding step has just happened. One of the difficulties of my project is that this step only lasts a minute and I only wanted to capture that moment.” Once Wesolowska determined the precise timing for a fresh collection of oocytes, she was ready to spike a new batch with hormone, this time around for fixation.