bnk EM
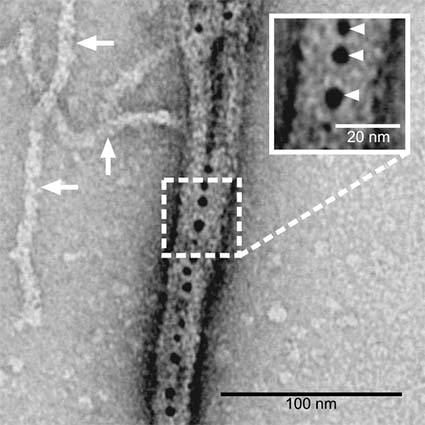
Figure 1. Electron micrograph showing actin fibres alone (white arrows, main image) or bound by Bottleneck, visualised with gold particles (black dots) using negative staining. Inset shows a zoom of an actin bundle, with arrowheads highlighting the localisation of bottleneck in the centre. IMAGE:…
Download:
full (425x425) | thumbnail (150x150) | medium (300x300) | medium_large (425x425) | large (425x425)