It’s the economy, stupid
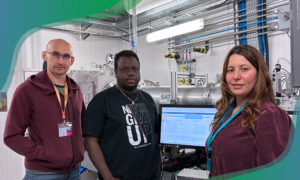
You might not think that your body’s biology has much in common with the workings of your credit card or the global banking system. Neither, at first, did Theodore Alexandrov. But the EMBL team leader is now applying the mathematical algorithms used to delineate the workings of the economy to analysing information about the countless molecules produced by our cells.
Alexandrov and his team are developing a new technology that maps where these molecules are in relation to each other in three-dimensional (3D) space. The work is leading to a new, spatially-aware understanding of biological processes such as the metabolism of our cells or the interactions between microbes in the environment, as well as offering insights into how they can go wrong. “If we want to truly understand how all these processes work, then we need to see where all these molecules are,” says Alexandrov. “This understanding is increasingly emerging in all fields.”
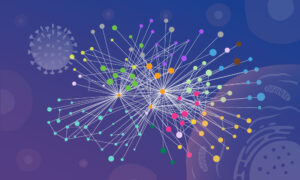
Using mathematical algorithms and big data technologies, similar to those developed to explain how economic events such as banking transactions change over time, the team have identified further members of the bewildering array of molecules produced by biological processes and mapped them to specific locations. The field in which they work is known as metabolomics: the study of the biochemical fingerprints produced by the reactions occurring in the cells in our bodies. A person’s metabolome is hugely complex and dynamic – doing something as innocuous as drinking a cup of coffee or eating a sandwich, for example, dramatically and in seconds alters the mix of substances produced by some of our cells and is thus detectable in our blood or urine. Different kinds of cells and tissues have different metabolomes, which can alter as a result of disease or a changing environment. Researchers are keen to understand these patterns in detail as they could give new insights into both normal and abnormal processes.
Molecular maps
But given that a metabolome contains thousands of ever-changing components, this is no easy task. To identify molecules in a sample, researchers usually turn to a method known as mass spectrometry, or mass spec for short. This involves ionising the molecules and passing them through a mass spectrometer, which uses electric and magnetic fields to ‘weigh’ each one. The machine detects the weights and produces barcode-like patterns known as ‘spectra’ that researchers can then interpret. However, some molecules come in a range of slightly differing forms, and so the spectra of samples containing many molecules can be extremely difficult to decipher.
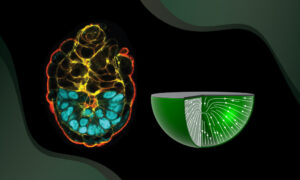
New developments in the field are providing even more information for scientists to contend with. One of these is imaging mass spec, which not only identifies molecules but also determines their location in space and presents this information visually as a kind of molecular map. For example, scientists can place a thin section of a tumour or cell culture on a microscope slide and use a laser to systematically vaporise the molecules within it, point by point across the slide. They can then cross-reference the molecules they find to the points on the slide from which they originate. Putting this location specific information together with the mass spec data requires powerful bioinformatics software – software that Alexandrov was in an ideal position to develop thanks to his background.
Maths to mass spec
Having completed a PhD in mathematics and statistics, Alexandrov embarked on a postdoc on a trans-European project in econometrics in Bremen, Germany, predicting bank transactions over time for a credit-card company. He was approached by a colleague who pointed out that Alexandrov’s expertise in developing mathematical processes, or algorithms, that track how things change over time, could also be applied to similar problems in the rapidly growing field of mass spectrometry. “For me this is the perfect field,” he says. “Now we’re working with gigabytes, even terabytes of data, my background in mathematics really helps.”
Now we’re working with gigabytes, even terabytes of data, my background in mathematics really helps.
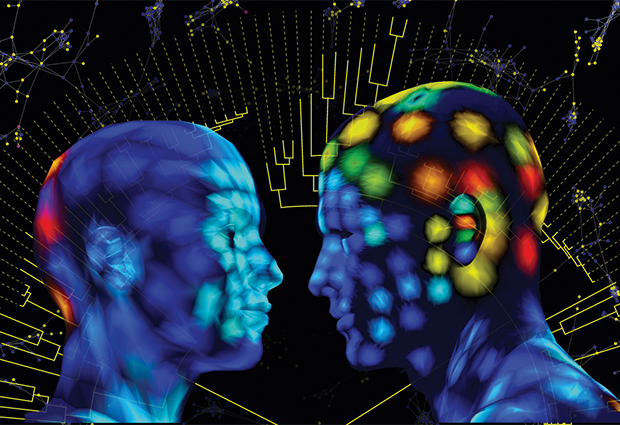
In 2012, together with Pieter Dorrestein from University of California San Diego, they came up with the idea of creating maps of metabolites on the human skin. This rapidly grew up into an ambitious project, also involving the labs of Rob Knight and Nuno Bandeira, aiming at mapping not only metabolites present on the skin, but also microbes. By combining mass spec and imaging information, the team was able to create a 3D map of the molecules clinging to the skin of two volunteers. What’s more, they also correlated this map with information on the distribution of different microbial species.
They found that the molecules on our skin are surprisingly stable. “Ninety per cent of the molecules we could attribute to their sources were from beauty products,” explains Alexandrov. “This included shampoos, skin lotion and sun cream, even though the volunteers were asked not to apply them and not to take a shower for three days before the sampling.” This rather surprising finding showed that such molecules persist on the skin for much longer than anyone expected. What’s more, the spatial information in the map also allowed the team to uncover molecules that might act as communication avenues between human and microbial cells. “What’s unique about our approach is that we always try to bring spatial information into the analysis,” he says.
Molecules and microbes
Thanks to this spatial analysis, researchers now have a better picture of the molecular environment of our skin’s surface. They also have a starting point to understand more about how this environment might affect our skin’s ecological relationship with its resident microbes. This is particularly relevant as the interconnections between our cells and the trillions of microbes that inhabit our bodies are currently of intense scientific interest, as evidence mounts that these microbes have a profound influence on our health.
It’s a very broad technology and its applications are unlimited
Moving mass spec into the third dimension promises to revolutionise many areas of research. “It’s a very broad technology and its applications are unlimited,” says Alexandrov. “It is now being used in clinics, biomedical research and pharmacy.” One key example is cancer research. Individual tumours contain cells that differ from each other, a phenomenon known as tumour heterogeneity. These variations cause the cells to behave in different ways, perhaps making some more prone to spreading or invading local tissue than others. Understanding these differences is therefore very important if we are to learn more about how the disease develops and progresses. “One cell can change everything,” says Alexandrov. Until recently, researchers studied such tumours by crushing them up and analysing them, thus losing sight of this heterogeneity. “Now, we can see molecular differences between the cells.”
Community conquests
Since joining EMBL in November 2014, Alexandrov and his team have been working on two flagship projects to push the technology forward. The first is a continuation of his collaboration with Dorrestein’s group, and involves developing the bioinformatics tools to map the spatial distribution of molecules in any environment. The team has designed a Google Chrome-based browser that makes it easier to visualise the 3D data and this has already been used in collaboration with other researchers to map molecules on bee antennae and coral reefs. The tool is free and interactive, and is already available for public use.
I’m pretty sure we’re just scraping the surface: we’re not getting the full molecular snapshots
The second project involves developing new algorithms and hardware infrastructure to allow users to identify more of the molecules in their samples. At the moment, the fact that one molecule can generate hundreds of different signals in a mass spec machine means that scientists can only interpret a small fraction of their spectra. “I’m pretty sure we’re just scraping the surface: we’re not getting the full molecular snapshots,” says Alexandrov. This work forms the basis of a European Horizon 2020 project that Alexandrov is coordinating, which brings together eight partners from academia and industry. “They are all interested in really getting this working as a community effort,” he explains.
But even as his team grapples with the challenges of moving mass spec into the third dimension, Alexandrov already has his sights set on the fourth. Being able to monitor metabolomes in time as well as space will let scientists track biological processes as they happen. “It’s still very preliminary, and we would like to improve the resolution to really understand this complexity,” he says. “But we can already see how metabolomes change over time.”