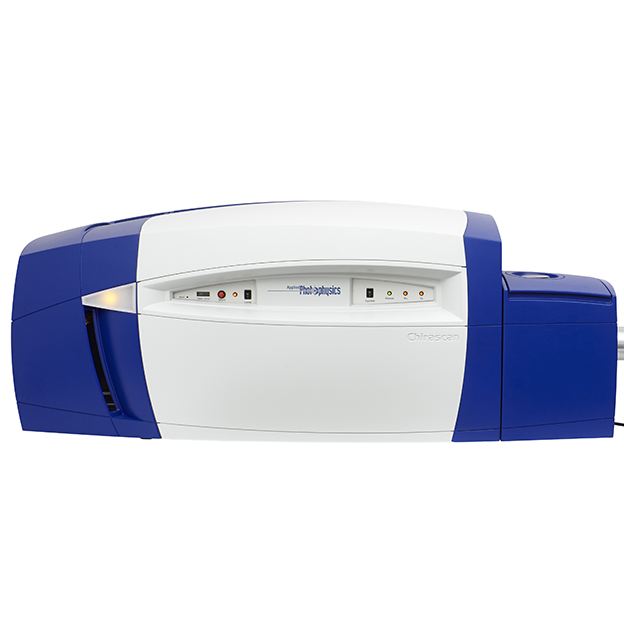
Edit

Sample Preparation and Characterisation Facility

Biophysical characterisation

Circular dichroism

Circular dichroism is the property of chiral molecules to absorb the right and left components of circularly polarised light to a different extent. CD spectroscopy measures this differential absorbance. Nearly all biological macromolecules are chiral and lend themselves to CD experiments. For example the secondary structure content of proteins can be analysed as alpha helices, beta strands and random coil have characteristic spectra. The temperature dependence of the CD signal gives information about protein stability and folding. Our CD spectrometer gives excellent quality scans down to 190 nm wavelength enabling quantitative secondary structure analysis. It is equipped with a thermostatted sample chamber for melting experiments.

Examples of applications are:

  • Estimate the protein secondary structure content
  • Detect conformational changes in protein that might result from changes in buffer composition or mutations in native protein
  • Assess the thermal or chemical stability
  • Analyze macromolecule-ligand interactions

Sample requirements: ≈200ul of sample at ≈0.5mg/ml, sample buffer should be compatible with CD measurment


Dynamic light scattering (DLS)

Dynamic light scattering is a well-established technique for measuring the hydrodynamic radius (RH) and size distribution profile of molecules in solution. In particular it measures time-dependent fluctuations in the scattering intensity coming from particles undergoing random Brownian motion. Diffusion coefficient and particle size information can be obtained from the analysis of these fluctuations.

Examples of applications are:

  • Check monodispersity
  • Estimate hydrodymaic radius
  • Determination of the aggregation temperature (Tagg) [between 5°C and 80°C]

Sample requirements: ≈7ul of the sample at >0.25mg/ml


Fourier-transform infrared spectroscopy (FTIR)

VERTEX 70v FTIR Spectrometer provides the possibility to acquire a complete far and mid IR spectrum from 6000 cm-1 to 50 cm-1 in a single step measurement with no need to change any optical component.  
FTIR-Spectroscopic Analysis of Proteins 

  • Determination of structural changes 
  • Measurement of temperature ramps 
  • Concentration determination
  • Secondary structure analysis
  • Protein-ligand-interaction

Isothermal titration calorimetry (VP-ITC)

ITC is a thermodynamic technique that directly measures the heat released or absorbed during a biomolecular binding event. The technique allows simultaneous determination of all binding parameters in a single experiment ITC (n, K, ∆H and ΔS). It directly measures sub-millimolar to nanomolar binding constants.


MicroCal PEAQ-ITC 

Measurement type: Affinity (KD), Enthalpy ∆H, Entropy ∆S,   Stoichiometry (n)

Sample volume: 280 µL

Cell volume: 200 µL

Injection syringe volume: 40 µL

Injection volume precision: < 1% @ 2 µL

Sample throughput: 0-12 per 8 h day

Noise: 0.15 ncal/s

Temperature range: 2°C to 80°C

Temperature stability: ± 0.00012°C

Response time: 8 s*

Multiple feedback modes: Yes (passive, high gain, low gain)

Notes: The MicroCal PEAQ-ITC Instrument Response Time is a true time constant.  It is the time interval between the first deviation away from the baseline, and the point on the peak that is 63% of the maximum peak height.


Surface Plasmon Resonance (SPR)

Surface Plasmon Resonance, also widely known as SPR or Biacore, is standard technology for interactional study of biomolecules. This technology has the advantage of being able to work with biomolecules in their native forms, without the need of introduction of label or tag. The SPR-based technology continuously monitors the changes of mass deposition on the detector surface, and allows sensitive and reliable characterization of biomolecular interactions and provides information such as association/dissociation rate and affinity.

Examples of applications are:

  • Measurement of kon, koff, KD
  • Understanding molecular mechanisms & structure-function relationships

Sample requirements: contact the SPC


Octet RED96 System 

The Octet RED96 system is ideally suited for 96-well characterization of protein-protein and protein-small molecule binding kinetics, and for the determination of protein concentrations and titer.

  • Large Quantitation Dynamic Range: The Octet RED96 system provides an unprecedented dynamic range from ng/mL to mg/mL for quantitation of biomolecules – 25 ng/mL to 2000 µg/mL of human IgG using Protein A biosensors.
  • Versatile Kinetic Analysis: Accurate kinetic analyses of large macromolecules such as IgG to small molecule fragments of 150 Da are possible on the Octet RED96 system.
  • 8-Channel Throughput: The Octet RED96 system uses disposable biosensors in an 8×12 array in a simple, Dip and Read label-free assay format to measure the titer of 96 samples in 30 minutes.
  • Concentration Analysis: Measure concentrations of native proteins and other biomolecules by direct binding from solutions in a 96-well microplate in a simple, one-step Dip and Read assay. A large dynamic range for direct binding from ng/mL to mg/mL combined with 8-well simultaneous read-out gives you results in 32 minutes for 96 samples. Run high sensitivity sandwich ELISA and other ligand binding immunoassays on the Octet system in just an hour or two!

Nanotemper Prometheus NT.48

NanoDSF is an advanced Differential Scanning Fluorimetry method for measuring ultra-high resolution protein stability using intrinsic tryptophan or tyrosine fluorescence.
Applications include antibody engineering, membrane protein research, formulation and quality control.


Nanotemper NT.LabelFee

Allows measurement of interactions between all types of biomolecules. Broad application range: from ions to ribosomes and for pM to mM binding affinities. Besides the dissociation constant MST datasets contain unique information about aggregation and sample quality.  

• Utilizes the intrinsic tryptophan fluorescence
• Real label-free and immobilization-free experiments
• Reflects binding of the protein in its native state


Nanotemper NT.115

Allows measurement of interactions between all types of biomolecules. Broad application range: from ions to ribosomes and for pM to mM binding affinities. Besides the dissociation constant MST datasets contain unique information about aggregation and sample quality. 

•Versatility to use of a broad range of fluorophores and fluorescent proteins
•Buffer independency: including serum or cell lysate
•Purification free for fluorescent fusion proteins.


SX20 Stopped-Flow Spectrometer

 Typically used to gain an understanding of reaction mechanisms including drug-binding   processes, or to determine protein structure, stopped-flow spectroscopy enables the   study   of  fast reactions in solution over timescales in the range of 1 millisecond to   hundreds of   seconds.

 A wide range of reactions can be investigated involving, for example:

  • protein-protein interactions
  • ligand binding
  • electron transfer
  • fluorescence resonance energy transfer (FRET)
  • protein folding
  • enzyme, chemical or coordination reactions.

Analysis of the resulting kinetic transient can determine reaction rates, complexity of   the reaction mechanism, information on short-lived reaction intermediates etc. A series   of stopped-flow experiments can be used to show the effect of parameters such as temperature, pH and reagent concentration on the kinetics of a reaction.


Evolution 350 UV-Vis Spectrometer

  • Optimized performance for advanced testing requirements and peak resolution capabilities with selectable bandwidths of 0.5, 1.0, 1.5, 2.0 and 4.0 nm.
  • Ensure accuracy of your data with optional Calibration Validation Carousel (CVC) for automated performance verification.
  • Get instant measurements and excellent performance over entire wavelength range of 190-1100 nm with xenon flash lamp.
  • Easily go from sample to final report – with intuitive INSIGHT Software guiding you every step of the way.
  • Obtain results you need for quantitative analysis, scanning and kinetics applications with comprehensive software tools for data collection, processing, and reporting.
  • Customize even complex methods with ease using workflow-oriented application modules.

Refeyn One – Mass photometer

The Refeyn One system applies the principle of interference reflection microscopy and interferometric scattering microscopy to quantify light scattered by a single molecule on a glass surface. The amount of light scattered by each molecule is directly correlated to its molecular mass.

Based on the above principle, the Refeyn One can monitor protein-protein interactions at a single-molecule level with high-sensitivity and can at the same time determine molecular weight of proteins and protein complexes with a high dynamic range and great accuracy. 

The mass photometer is an ideal tool for quality control in the protein structural analysis workflow as it can assess the molecular mass and the oligomerisation status of a sample in one measurement.

Sample Requirements

  • Sample concentration and volume: The amount of protein needed for an analysis is very small, between 5µl to 20 µl  of protein solution needed at a nano-molar concentration range ( e.g 100 nm). After the initial set up, measurement takes in general one minute or slightly longer if required. 
  • Mass range: 40 kDa -5 MDa
  • Concentration range: 100 pM-100 nM (particle concentration)
  • Buffer requirements: Centrifuge buffers (0.22 microns or 0.11 microns) prior to the measurements. Avoid buffers with high percentage of glycerol.
  • Membrane proteins could be measured upon consideration.

SURFE²R N1 (SSM-based electrophysiology)

The SURFE²R N1 is designed for the measurements of electrogenic transporters (symporters, exchangers and uniporters) and pumps. Usually these proteins have low turnover rates compared to ion channels. SURFE²R technology compensates for that with a large sensor size which allows for the measurement of up to 109 transporters at the same time to yield the best signal to noise ratio.

Sample Requirements

  • Source material: Sample preparation commonly begins either with recombinant overexpression in eukaryotic cell lines (CHO, HEK and COS-1), bacteria or yeast. Cell free expressed transporters in nanodiscs as well as whole cells have been used for adsorption to the SSM, but usually purified samples are required.
  • Membrane purification: When using isolated membrane samples, after cell disruption the membranes should be purified using a sucrose density gradient centrifugation. Sucrose gradient centrifugation yields a significant signal enhancement compared to non-purified samples.
  • Protein reconstitution: High turnover transporters usually work with membrane preparations. But they show lower signal to noise compared to reconstituted samples. The ideal sample therefore is prepared by protein purification followed by reconstitution into liposomes at high protein densities. When using reconstituted samples it is critical to ensure that no residual detergent remains in the membrane preparation after reconstitution. If detergent remains in the protein sample, the sensor can be destroyed during the adsorption process.
  • Sample Concentration: The lipid concentration has to be optimized before starting the experiments. Usually lipid concentrations between 0.2 mg/ml and 5 mg/ml are used. In the case of membrane preparations with unknown lipid concentration, the total protein concentration can be used as a benchmark. Typical samples are prepared with 2 mg/ml to 10 mg/ml total protein concentration. For adsorption to the SSM total protein concentrations between 0.1 and 1 mg/ml are used. Since the concentration of the protein of interest cannot be adjusted directly, the output mainly depends on the expression efficiency which, therefore, also has to be optimized.
  • Sample Volume: For each sensor 5 to 10 µl of the diluted sample is required. If the sample amount is critical this volume could be reduced even further. Therefore 50 to 100 µl could be enough for a rough characterization of the transporter. Depending on the measurement sequence it takes up to a few days to measure 100 µl of the sample.
Edit