Energy savings at EMBL – a 2022 update

Energy saving measures across EMBL sites led to a significant reduction in our total energy usage in 2022, reflecting our commitment as an organisation to reduce our environmental impact and embrace sustainability principles.
One of the five goals of EMBL’s Sustainability Strategy (launched in 2021), is for EMBL to reduce its energy-related emissions by 50% by 2030, compared to its 2019 baseline. As well, 2022 saw increasing energy prices with significant impacts on EMBL’s finances. To meet this target and help with rising costs, a pan-EMBL Energy Group was set up and helped implement a series of initiatives aimed at reducing our energy use and related carbon footprint.
Teams across EMBL sites each played their part in responding to new energy savings targets and tackling the energy crisis. From improvements to beamline equipment in Hamburg, to reducing office temperatures in Barcelona, to Laboratory Animal Resources reducing air exchange rates in the animal house, we saw a real ‘One EMBL’ response.
The results of these initiatives show how such actions have helped EMBL diminish the crisis’ financial impact, reduce waste, and most importantly, reduce our long-term environmental impact.
Comparing energy usage between 2021 and 2022
To accurately judge how well the organisation reduced its energy use, we also have to consider factors like weather and a growing campus.
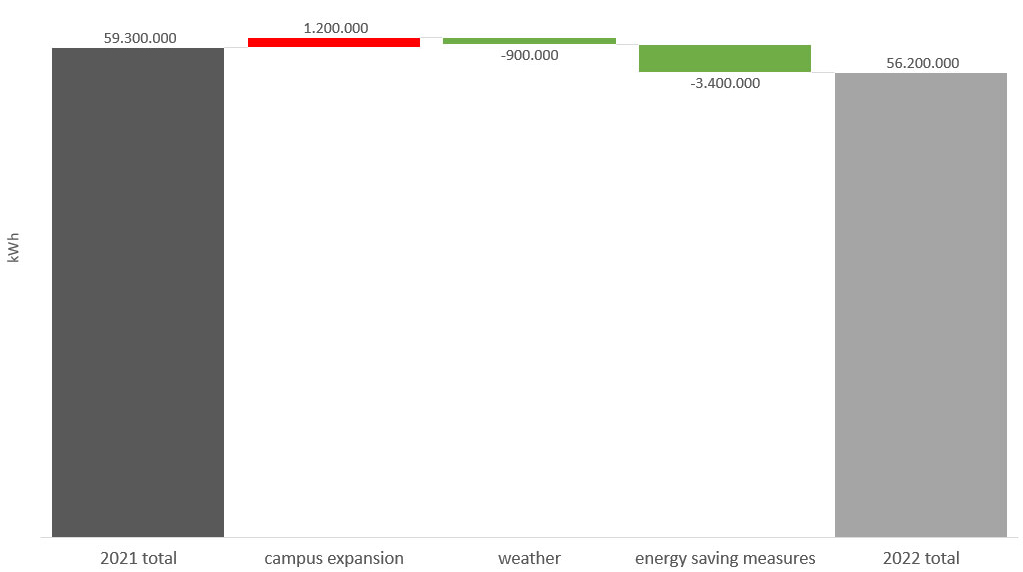
The waterfall chart below shows the impact of some of these factors on EMBL’s energy use. As the first column indicates, in 2021, EMBL used around 59,300,000 kWh of energy; electricity, gas, and district heat. The Heidelberg campus expanded in 2022 with the new EMBL Imaging Centre and the expanded EMBO offices, which added around 1,200,000 kWh of energy demand, as seen in the second column.
The weather in 2022 was more favourable than 2021; despite the hot summer across Europe, it was a mild winter and overall less energy was needed to keep campuses heated and cooled. This led to an estimated reduction of 900,000 kWh in energy demand. The total energy use in 2022 was around 56,200,000 kWh.
Taken together, the data show that the energy saving measures we implemented in 2022 saved around 3,400,000 kWh1 of energy, a 6% reduction!
Here are some of the actions taken and the amount of energy they saved.
Gas consumption
The energy crisis started off as a gas crisis in early 2022, and the immediate concern was whether our essential gas supplies were at risk of being switched off. While teams in administration and the EMBL Heidelberg Director’s Office worked on scenarios to protect our supply, we also took measures to protect essential gas reserves.
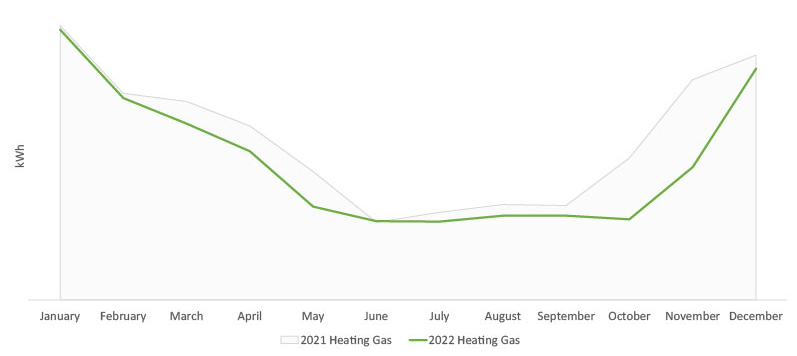
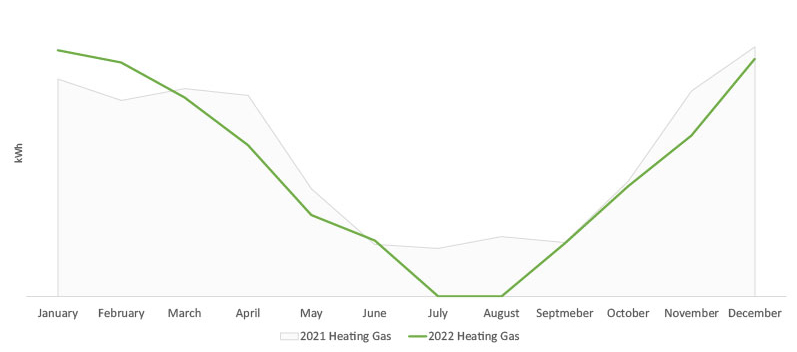
These measures included not heating unoccupied areas, like stairwells and corridors, limiting office and lab temperatures to 19°C, and reducing the number of hot water taps for hand washing. The following charts compare the monthly gas consumption in Heidelberg and Hinxton between 2021 and 2022. The impact of the measures can be clearly seen – a 1,500,000 kWh (15%) reduction in gas use in Heidelberg and a 220,000kWh (11%) reduction in Hinxton.
It’s worth noting that removing hot water from sinks primarily used for hand washing has saved at least 78,000 kWh during this period.
Further gas savings came from the combined cooling, heating, and power plant (CCHP) in Hinxton. The CCHP is a big engine which generates electricity and cooling for the site’s data centre by burning gas. Capturing the heat that the CCHP generates and using it on campus makes this an efficient way to generate energy when conditions are right. However, reduced demand for cooling the Hinxton data centre and maintenance issues in February and December of 2022 resulted in the CCHP actually using 600,000 kWh less gas in 2022 compared to 2021.
Electricity usage
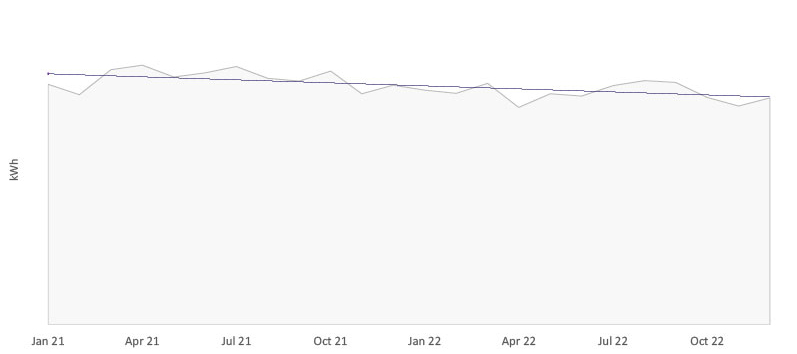
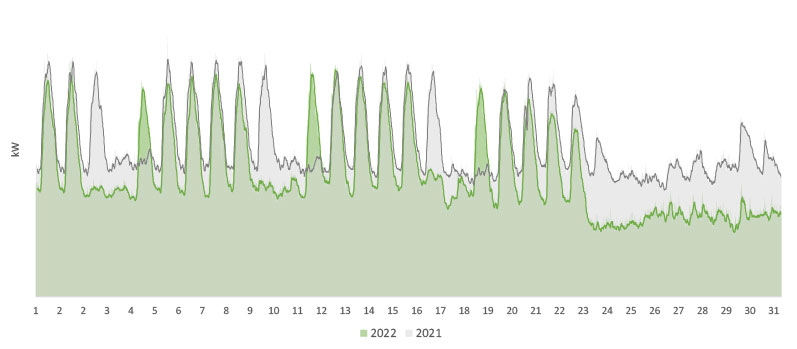
Looking at electricity use in 2022, we benefited from the work done by our IT service teams, who have succeeded in reducing the amount of electricity consumed by our data centres despite an increasing demand for their services.
Data centres account for 36% of all the electricity consumed by EMBL, so savings here have a material impact. Various measures have been taken across EMBL to improve IT service’s energy efficiency, including limiting CPU speeds, moving data to more efficient data centres, and reducing the demand for cooling. All these measures have resulted in energy savings of 670,000 kWh (11%).
It’s worth noting that removing hot water from sinks primarily used for hand washing has saved at least 78,000 kWh during this period.
Further gas savings came from the combined cooling, heating, and power plant (CCHP) in Hinxton. The CCHP is a big engine which generates electricity and cooling for the site’s data centre by burning gas. Capturing the heat that the CCHP generates and using it on campus makes this an efficient way to generate energy when conditions are right. However, reduced demand for cooling the Hinxton data centre and maintenance issues in February and December of 2022 resulted in the CCHP actually using 600,000 kWh less gas in 2022 compared to 2021.
Electricity usage
Looking at electricity use in 2022, we benefited from the work done by our IT service teams, who have succeeded in reducing the amount of electricity consumed by our data centres despite an increasing demand for their services.
Data centres account for 36% of all the electricity consumed by EMBL, so savings here have a material impact. Various measures have been taken across EMBL to improve IT service’s energy efficiency, including limiting CPU speeds, moving data to more efficient data centres, and reducing the demand for cooling. All these measures have resulted in energy savings of 670,000 kWh (11%).
In summary
Overall, EMBL reduced its energy consumption by 6%, improved its energy intensity2 by 17% and reduced its energy-based carbon emissions by 5% in 2022 – a fantastic achievement. However, we must remain vigilant and continue to implement energy-saving changes. Our forecasted energy cost for 2023 is still over €15 million – a 300% increase over 2021’s costs. To mitigate these costs, EMBL has set a target to reduce energy use by 15% in 2023 compared to 2021. Thankfully, the measures we have taken should get us there, but we are still a growing organisation with new activities planned for this year. Looking longer term, we have committed to doing our part to reduce our environmental impact and to tackle the ever worsening climate crisis. Ultimately, that will be a much bigger, longer-term crisis than the current energy crisis.
[1] This is equivalent to the energy used by 230 average UK households in a year.
[2] Energy intensity is the amount of energy used per square metre of space per year.