Edit

Annual Report 2024

People, Processes, Places

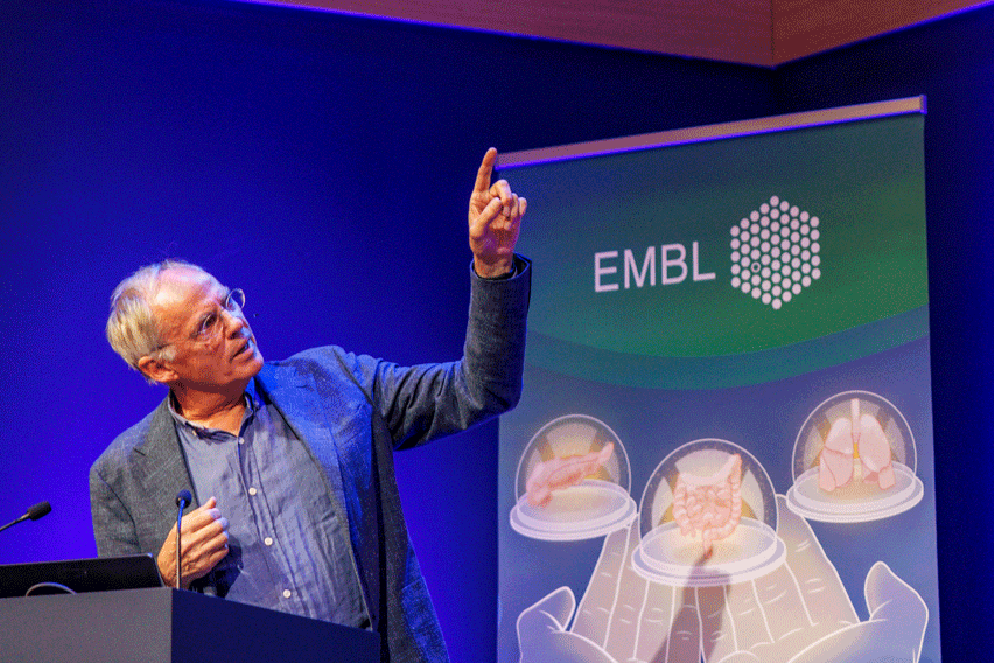
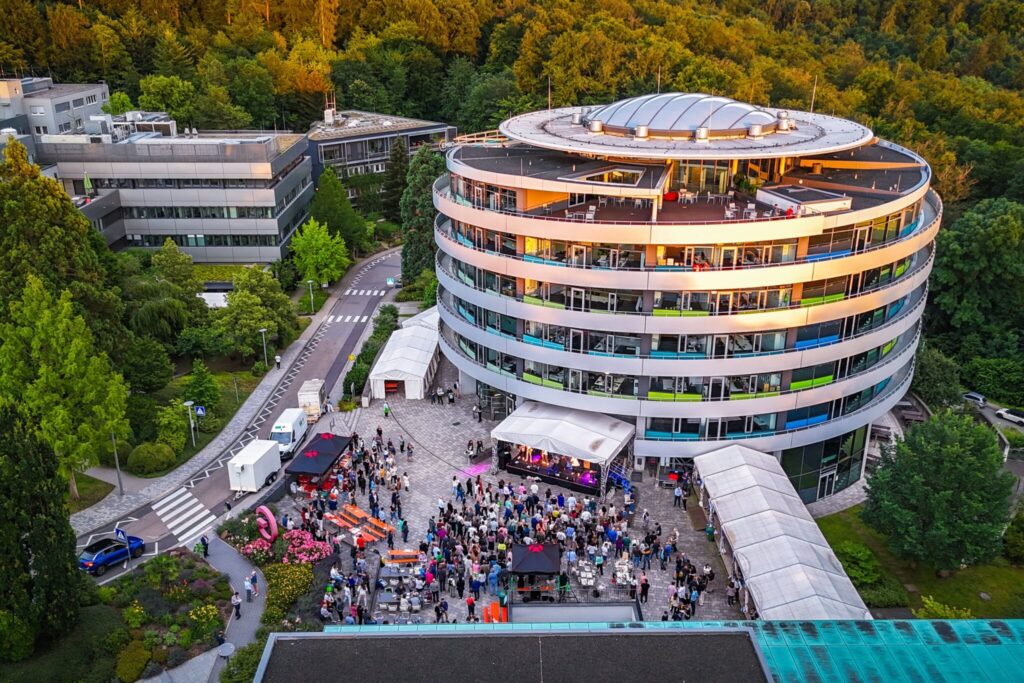
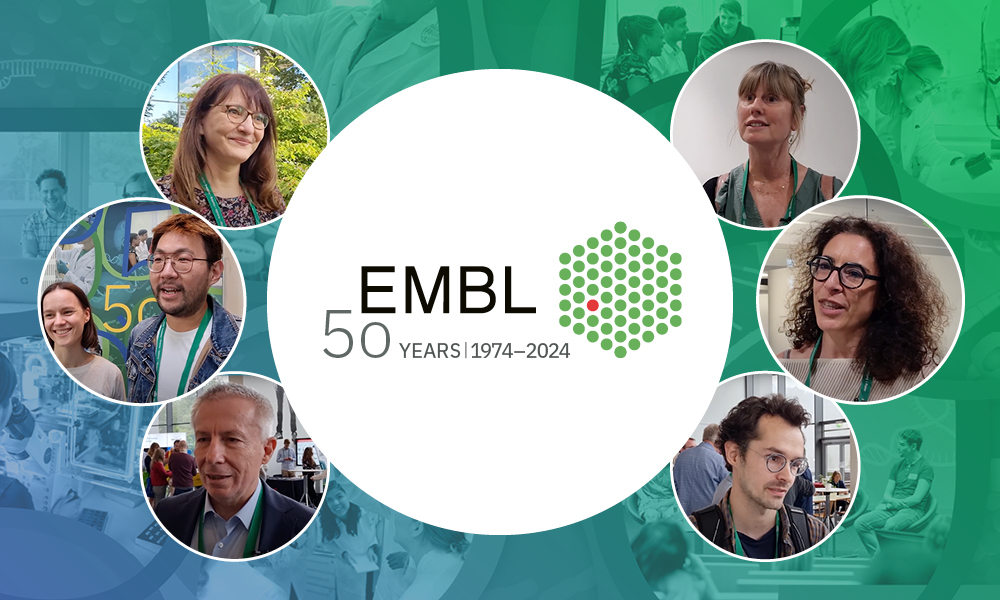
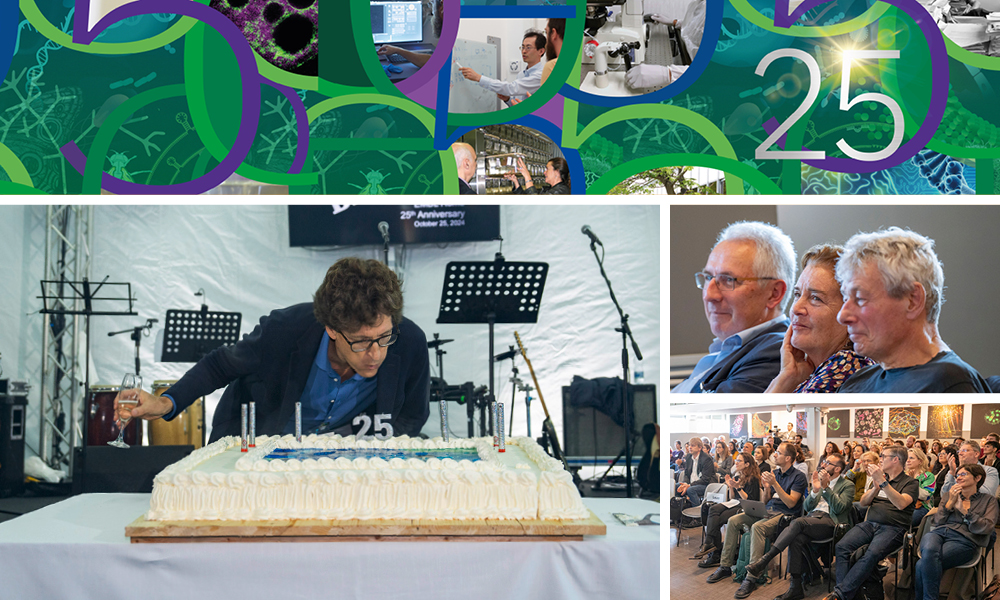
For many people, 2024 will be best remembered as EMBL’s 50th anniversary, with a scientific symposium that brought together its vibrant community, showcased its many scientific contributions, and drove discussions on the future of Europe’s leading life sciences laboratory.

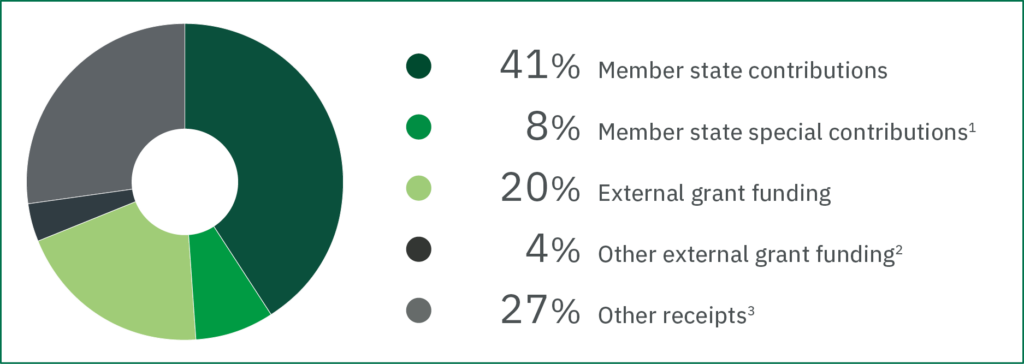
As an intergovernmental organisation that delivers world-class life sciences research, training, and services, EMBL is committed to further modernising operations to ensure its operating model, systems, processes, and facilities support EMBL’s innovative, collaborative culture.

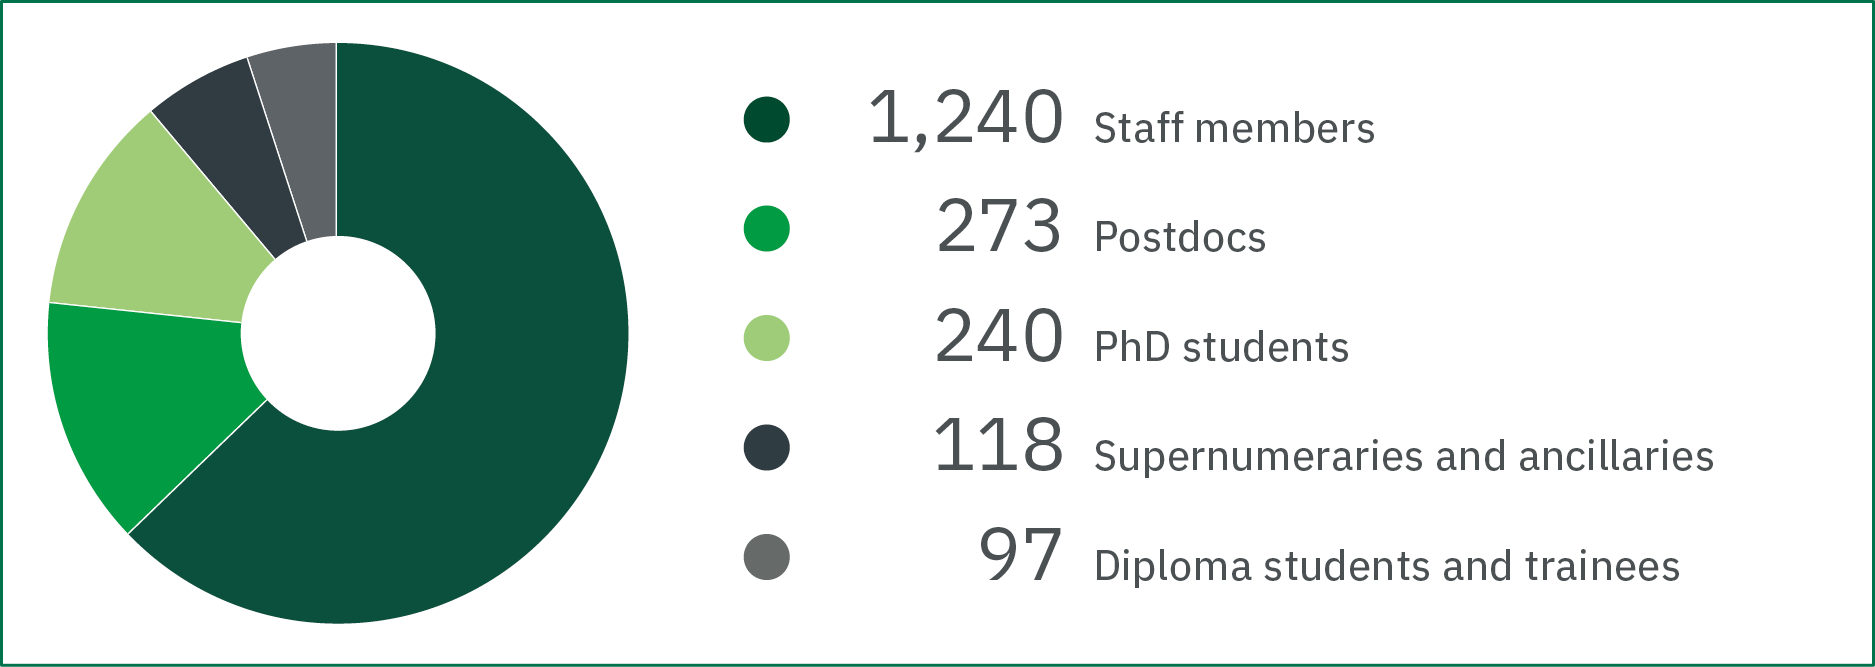
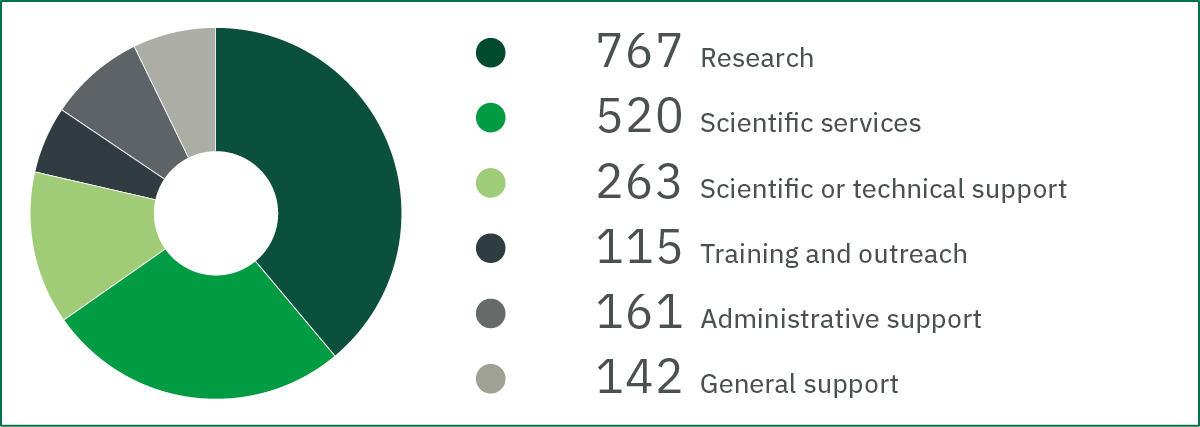
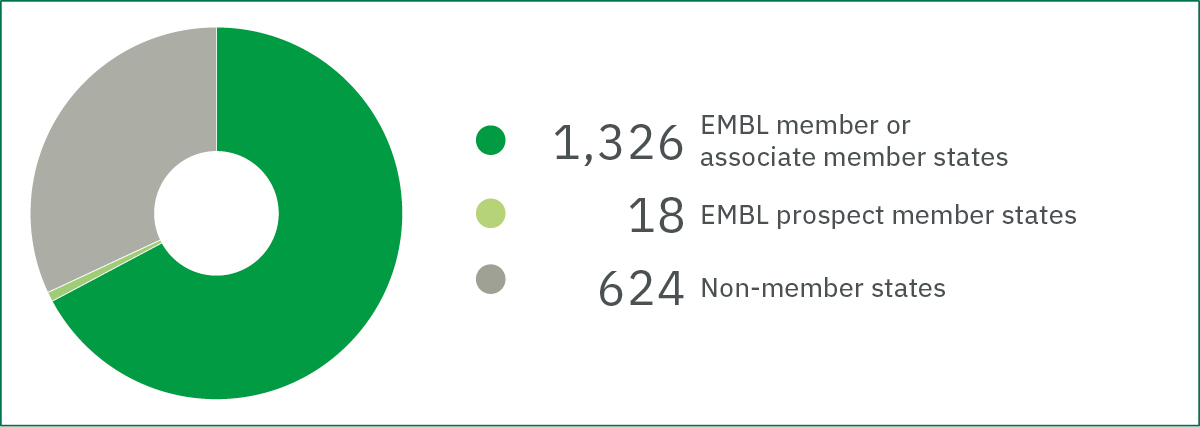
The 50th anniversary scientific symposium brought together the EMBL community from far and wide, especially alumni through the years, many attending remotely. In this section highlighting EMBL’s people, processes, and places, we also feature those people and things that continue to make EMBL successful as a workplace and a hub for doing world-class science.


“EMBL showed me that if you fill a sandbox with some really cool toys, mix in some super smart kids from all over the world, and just let them play and imagine, magic will happen.”

Kelly McNagny, Professor of Medical Genetics, University of British Columbia, Vancouver, Canada; EMBL Postdoc and Visiting Scientist (1991–1998)

How we do science

Scientific excellence thrives when the organisation thrives. EMBL continues to prioritise and advance many initiatives, including those in sustainability, responsible research assessment, and bioethics.

Names and faces

EMBL’s alumni are a network of highly trained scientists and other professionals, 82% of whom live in EMBL member states or associate member states. These alumni bring the EMBL model of research to member state institutions and help to connect local scientific communities with EMBL’s research, services, and training.

EMBL evolving

Between celebrations of EMBL’s 50th, EMBL-EBI’s 30th, and EMBL Rome’s 25th anniversaries, the year was filled with constant reminders of the organisation’s continual growth. Reshaping its unit structure to better draw in a molecular systems approach was just one more way that EMBL is thinking about its own future and the future of life science research.

People, Processes, & Places in Numbers

Gender distribution at EMBL

EMBL aims to be transparent about its gender distribution. While gender distribution is balanced across the organisation as a whole, the EDI strategy aims to balance the inequalities seen in some staff categories.

Pie chart showing: female personnel 49% male personnel 51% And bar graph showing male to female ratios of staff in roles: 51% 49% research* 40% 60% scientific services 34% 66% scientific or technical support 81% 19% training and outreach 74% 26% administrative support 47% 53% general support

Footnote: One personnel member identified as non-binary


A more sustainable EMBL

EMBL-wide energy-saving measures significantly reduced total energy usage compared to 2019 – the baseline year for EMBL’s sustainability strategy. The results reflect EMBL’s commitment to reduce its environmental impact and embrace sustainability practices. Additionally, 100% of its labs have adopted energy-saving measures as ‘LEAF’ labs.

Graphic showing: 22% reduction in energy-related carbon footprint 18% reduction in business travel emissions 30% reduction in residual waste

EMBL Alumni Relations 

EMBL’s 6,281 alumni are a network of highly trained scientists and other professionals who bring the EMBL model of research to other institutions and help connect local scientific communities to EMBL.

Pie chart showing percent of Alumni in different countries: 81.1% Europe 3.9% Asia 0.2% Africa 1.8% Oceania 12.4% North America 0.7% South America

Personnel

Total 1,968 in full-time equivalents (FTE)

Personnel categories
Pie chart: 1,240 staff members 273 postdocs 240 PhD students 118 supernumeraries and ancillaries 97 diploma students and trainees
Staff classification
Pie chart showing: 767 research 520 scientific services 263 scientific or technical support 115 training and outreach 161 administrative support 142 general support
Staff nationalities
Personell stat: 1,326 EMBL member or associate member states 18 EMBL prospect member states 624 non-member states

Financial report

Financial report

Member states provide the majority of EMBL funding, with additional external support from a wide range of grant-endowing bodies and philanthropic contributions.

EMBL total income

€358 million

Pie chart showing total income: 41% member state contributions 8% member state special contributions1 20% external grant funding 4% other external grant funding 27% other receipts
External grant funding

€72.1 million

Pie chart showing funding from: 21% EC, 9% ERC, 21% NIH, 17% Wellcome Trust, 6% BBSRC, 5% DFG, 3% BMBF, 1% HFSPO, 16% Others

1. Includes recent contributions from the UK Government and Wellcome to support the construction of EMBL-EBI’s Thornton Building and UKRI’s continued capital support of EMBL-EBI’s open data resources, via the Data Infrastructure Programme, technical transformation work.
2. Includes ELIXIR member state contributions.
3. Includes items such as philanthropic donations, contributions from EMBO, course and conference fees, internal tax, and income from the Heidelberg canteen, cafeteria, and guesthouses.


Member state contributions
Ordinary contributions X €1,000 % Austria - 3,222 2.2 %. Belgium - 3,925 2.7 %. Croatia - 410 0.3 %. Czech Republic - 1,670 1.1 %. Denmark - 2,680 1.8 %. Finland - 1,918 1.3 %. France - 20,268 13.9 %. Germany - 30,124 20.7 %. Greece - 1,479 1.0 %. Hungary - 1,054 0.7 %. Iceland - 190 0.1 %. Ireland - 1,904 1.3 %. Israel - 3,119 2.1 %. Italy - 15,026 10.3 %. Lithuania - 425 0.3 %. Luxembourg - 351 0.2 %. Malta - 103 0.1 %. Montenegro - 44

EMBL total expenditure

EMBL’s expenditure prioritises research, scientific services, and training activities – all of which are geared towards collaborating with, scientifically supporting, or training member state scientists.

€358 million

Expenditure
Pie chart showing expenditure: Expenditures 64% staff costs 30% operating costs 6% equipment expenditures, including depreciation
Expenditure by area of activity
Pie chart showing: 33% research 29% scientific services 11% scientific or technical support 7% training and outreach 8% administrative support 12% general support
Edit